Artash Nath (Grade 8) and Arushi Nath (Grade 5) On 12 March 2020, it was announced that all public schools in Ontario, Canada would close further for 2 weeks after […]
Artash Nath (Grade 8) and Arushi Nath (Grade 5)
On 12 March 2020, it was announced that all public schools in Ontario, Canada would close further for 2 weeks after the March break due to the COVID19 lockdown. The initial excitement of a longer March break soon turned to boredom when it became clear the schools will not open for the rest of the academic year.
Quantifying + Sonifying Impacts of Lockdown.
Did Seismic Vibrations, Street Noise, Vehicle Count, Pollution decrease in Toronto?
— HotPopRobot: Tech4Good Ocean-Space-Earth-Society (@wonrobot) June 25, 2020
We were waking up later and later every morning. And even then we could hear the loud sounds of birds chirping and we could hear the chirping until early afternoon. The general hum of the city – of cars speeding by, the rattling of streetcars, horns of construction trucks, the odd throttling of the motorcycles seemed to have disappeared. Even though we live in the city, it felt we were transported to the countryside.
It was hard to ignore the silent but singing voices of the nature telling us that things are chnging – wake up earlier and measure us!
Artash (Grade 8 student) + Arushi (Grade 5 student) created The Masked Scales Project
We are curious. We are makers. We like to learn by building new things, setting up experiments, doing fieldwork, and then demonstrating our results to others.
We could not resist the call of the birds. They gave us an idea to create a project to measure how the environment around us is changing because of the COVID 19 lockdown? This was the origin of the Masked Scales project.
The Masked Scales project: What did we want to Measure?
The beauty of the human mind is that once you set it free, it soars high. Our mind too was teeming with big questions that we wanted to find the answers about. Would the COVID19 lockdown have increased the bird density in the city skies, would the closure of all economic activities have affected the rotation of the Earth, would an Alien civilization be able to figure out that something drastic must have happened on Earth?
All questions are good questions. But from our previous experiences of making projects, we knew we had to limit our imagination for the time being and focus on practicality to come up with workable project design. Once we have made something and it works, we could always keep improving it or make newer versions of the same.
So between the two of us, we limited our questions to:
Has the noise levels on our streets gone down?
Has the air we breathe become cleaner?
Have the traffic levels on our streets gone down?
Has the lockdown affected the vibration of the Earth due to the stopping of businesses, economic, and construction activities?
Designing our Project and Changes Made
Once we had broadly agreed on what questions we wanted to answer, we got started. As before, all our project designing starts with a pencil and paper. We made rough sketches of how our project would look like, where it would be set up, how different components of the projects would be wired up.
Arushi installing the sensors on an old plastic tray
We together discussed what kinds of sensors and cameras we could use, what data they would collect, at what intervals, to which computer that data would go, for how long we would collect that data, what kind of analysis we could do with the data and what answers that analysis would provide. We had to often use the internet to do some research on sensor types, their accuracies, and if they have libraries available in Python or Arduino.
This is a very important stage of our project design. This is where the imagination starts meeting the reality and we have to bring in new ideas or modifying existing ones to make things work.
Artash fixed Intel RealSense camera to the window to get live Traffic Flow on King Street
We quickly realized that the location of our house would not allow all our sensors to be placed in one place. For getting the traffic could we would need our cameras to face oncoming traffic (in East-West direction). However, to ensure that our light sensors and sound sensors accurately record data, we needed to have them facing North. This way the light of the sun would not fall directly on the light sensors. And our sound sensor would be aimed at streets to collect ambient noise and not directly facing incoming traffic sounds.
Together we now had agreed on the rough design of our project, its various stages (Building, Wiring, Installing, Testing, Data Gathering, Analysis) and complexities and roughly how long it would take us to build it and get it to work. We then multiplied everything by 2 as it always takes twice the time than we imagine as we are not able to foresee all the problems we would face at the beginning.
Arushi ready with her instrument to measure changes happening during COVID19 Lockdown
And then we split. Arushi was confident that she could figure out how to measure street noise and cleanliness of air around us, program the sensors, and get live data. That left me with the task of finding ways to automatically count the cars flowing down King street and measure if our Earth had started vibrating less. Not sure if the tasks were evenly distributed but we are fine if the tasks that we take challenges us.
Building the Instrument
Arushi took an old plastic tray that was not being used in our house. She made a rough layout on the tray to place my sensors. This was done to ensure that each sensor is placed in such a way that it does not affect the readings of the other.
Arushi drilled holes in them to fix the sensors on them and then glued them so that they would not move with the wind.
The Set of Sensors fixed outside our home and collecting data for 2 months
After affixing all the sensors, Arushi wired them to an Arduino that would power all the sensors, collect their data, and transmit it to her laptop.
To fix the cameras, Artash thoroughly cleaned one of the windows and affixed the camera to it using duct tape. Then he took a long USB extension cord to connect the camera to his computer.
Measuring Changes: Street Sounds to Traffic Flows to Vibrations of Earth using Sensors and External Data
We often have to dismantle some of our older projects to get the components for our newer projects. It is not a good feeling as we often use our older projects to give demonstrations at various public events. So where possible we try to make our projects modular so that we can use the same components for more than one project.
We ended up collecting the following sensors and cameras for this project.
Light Sensor: It measures the light around us. It has a photo-resistor whose value decreases when light falls on it. It is the base sensor that will help us visualize separate daily data readings as well as changes in data collected during day and night.
Sound Sensor: To listen to street noise around us. It is similar to a microphone but gives analog values of sound levels. This raw data then has to be calibrated to understand how it changes with the change in sound levels.
PM 2.5 Dust Sensor: It is a sensor to measure particulate matters of 2.5 microns in the air. There is a small heater in the sensor which directs the flow of air in the sensor in an upward direction (convection current). The flow of air passes through infrared light which bounces around. The more the bounce the more the particulate matter or more polluted the air.
Temperature Sensor: We wanted to see how much the temperature was changing around us. The sensor is just like a digital thermometer but it prints out the readings.
Humidity Sensor: It measures how damp the air around is. We measure humidity and temperature as they both affect the pollution levels.
Intel RealSense Camera: To get a wide overview of the traffic on King Street. Its high resolution allows us to apply machine learning for object identification and tracking.
Data gathered for the Masked Scales Project
In addition to getting data from our sensors, we had to rely on external databases to get some other information.
Covid19 Infection Rates in Toronto: from City of Toronto Public Health website
The intensity of Night Lights Over Toronto: Using NASA Night Light Data to understand changes in night lights over Toronto during different weeks.
Seismic Vibrations in Toronto: We got the displacement data of Earth along the vertical direction from the Leslie Spit Seismic Station in Toronto.
Programming, Calibration, Testing and Installation
It took us a few days to put together all the sensors, program them, test them individually, and calibrate them. The biggest challenge was to make all of them work together. This is always an issue as some sensors have different voltage ratings, current requirements, and even different baud rates over which they transmit data (depending on how sensitive they are and how quickly they collect and release data).
We used 2 Arduinos to connect all the sensors. We had to use two Arduinos as the PM2.5 Dust Sensor simply refused to work with other sensors. It draws more current than the others (possibly because of the heater element) and we had to connect it to a separate Arduino.
This also meant we had to write a separate Python program to bring together readings from two Arduinos together and match their time stamps. This was a difficult task as the PM 2.5 sensor collected reading once every 15 seconds while all other sensors collected readings much more frequently. Our eight years of combined experience in programming in Arduino and Python came into full use in making this works. And this was just the beginning.
Our Scientific Instruments had 2 parts: Sensors and Camera. We installed our collections of sensors in the North facing part of our house and our camera facing West to record live traffic data. Both of these provided data to different computers.
Data Flows and then Overflows
After a few tweaks and changes in settings, our instrument started to work well and started to transmit data from all its sensors and camera. We were generating an enormous amount of data every data. In our excitement to get very accurate results, we had selected a very high sampling rate for the sensors.
It is one thing to manage live numerical data coming in from one sensor. But it is a totally different thing to manage time-stamped data coming in numerically, visually (in the form of videos and images), and even in sound bytes. And have this keep coming over days, weeks, and even months. Our limited computing storage and processing power at home would soon get saturated with this abundant flow of data.
Data Analysis Tools used to find Trends from data being gathered
We had to resolve this problem quickly if we had some hope of analyzing the data. We went back to our computers and wrote a Python program to clump together incoming data and take averages so that we can reduce the data flow to more manageable levels. As we were more interested in measuring the trend of changes happening during COVID19 lockdown it turned out to be a good step.
In the case of data flow from video Camera, as we could not take averages, we had to restrict the number of hours it would collect readings every day.
Data Analysis Tools
To analyze data, we turned to a number of tools: Python, Excel, Machine Learning, Data Sonification software.
Python and Excel were used to get data from numerical sensors using Arduino to Python Serial Bridge.
To analyze video images and identify objects. their movements and direction, Artash turned to Machine Learning Algorithms. The camera took 2 photographs at an interval of 5 seconds. A program using Python and Sci-Kit Learn was written to compare the 2 images by subtracting one from the other to find what objects moved, machine learning helped identify the moving objects. The moving objects were then counted, their direction ascertained, and added to the total to get a live count of Vehicular traffic on the King Street.
Results Obtained: What did we find out?
It was interesting to see the results obtained from the analysis of data gathered by our instruments. We were able to get answers to all the questions we had initially thought about.
A Decrease in Street Sound Levels
The sound levels fluctuated a lot during the lockdown period. However, during the lockdown period, we noticed some of the lowest levels of street sounds (between 1 and 20 units). The streets never became that quiet again after the lockdown ended (they stayed above 20 units). While the overall sound levels trend during and after the lockdown are not very clear, there were lot more sound spikes after the lockdown was over. Sound levels were also lower during the weekends than the weekdays.
Trends in Street Level Noise in Toronto
Toronto Air Turned Cleaner
We saw a clear increase in air quality surrounding our house. The average PM 2.5 Pollution count was during the lockdown was 17 000. After the end of the lockdown, on 3 May, it soared to 30 000. After calculating the average of the pollution levels, we found a 40% increase in emission levels after the lockdown.
In the pollution time-series graph, we also noticed that for each day, there was a definitive peak, indicating the time with most pollution. Day and night cycles were also very clear in the graph. Every night, pollution levels would go down and start to rise in the morning.
Trends in Pollution Levels in Toronto
Traffic Flow Decreased Significantly
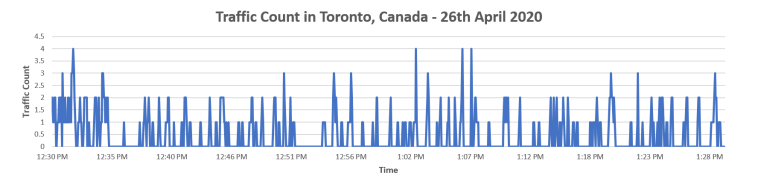
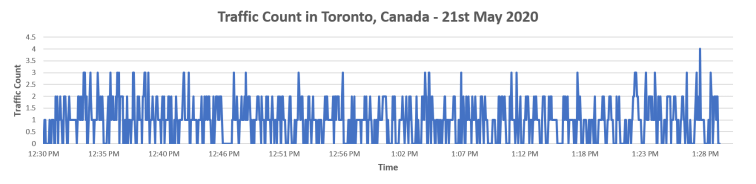
Instead of sampling traffic data for entire days, we decided to compare traffic count graphs from 12:30 to 1:30 PM every day to reduce the amount of data we could handle. Below are the graphs for the 26 April (during lockdown), and for 21 May (after lockdown). The difference is very clear. To properly determine the amount of change in the traffic count for the 2 days, we calculated the average cars seen every 5 seconds from 12:30 pm to 1:30 pm
Trends in average Traffic Flow (26 April and 21 May)
On 26th April, we calculated around average traffic of 1 car seen every 10 seconds. On 21 May, it came out to 2 cars seen every 10 seconds. The number of cars on the road on the road had doubled after the lockdown. This was a very satisfying finding as it took a lot of effort, programming and processing power to do an analysis of live traffic data.
The Earth Became Quieter
We had used seismic vibration levels as an indicator of movements of the earth. The movements of Earth could be because of natural reasons, like earthquakes, volcanoes, or waves. And they could also be caused by human-made reasons such as vehicular traffic, subways, and construction.
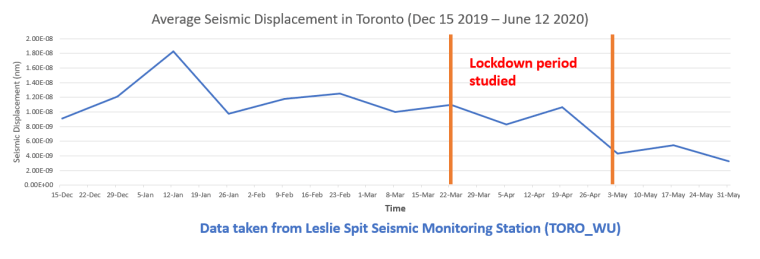
Trends in Seismic Noise in Toronto
We analyzed the data we received from the Leslie Spit Seismic Station (TORO_WU). It was an enormous dataset as it had 100 readings a second and for the entire 6 months period it was close to billion lines of data. We had to clump the data to 15 minutes averaging, then to daily averages and finally to two-weeks average to get the trend.
During the lockdown period, seismic vibrations decrease by around 34%. So the Earth had certainly become quieter.
The conclusion from the Project
From the above trends, we could conclude that our surrounding environment had become quieter, cleaner, there was less traffic flow and even the vertical displacement or seismic vibrations had decreased.
Overview of Trends Observed in Toronto during and after the Lockdown
Sonification of Data
Doing science and making projects are more fun if we can reach out to more people, share with them the findings of our projects, excite them, and interest them to build projects of their own.
We always make efforts to reach our science to other kids and their families. Sonification of our analysis – converting our data into a Musical was one way to reach out to more people. As we both love music – playing guitar and piano, this would allow us to bring other skills into science.
Jamming to convert data gathered from sensors and our analysis to music
We selected and compressed 2 weeks of data (26 April to 10 May) from our sensors and analysis and converted them into sound files. We did so by assigning different musical instruments to different data from sensors. The values of the sensors determined the notes and the pitch and intervals were determined by secondary data gathered such as Night Light intensity over Toronto night skies and COVID19 Infection rates in Toronto.
We used the free Musical Algorithm software (www.musicalgorithms.org) to bring all the data together and create the COVID19 Lockdown Musical.
Assigning a Different Musical Instrument to Each of the Data Gathered from Sensors or External Data
Listen to the Toronto Lockdown Musical
The sonification of the lockdown data came out very nicely. Halfway through the musical, the tempo goes down and the volume slightly decreases, as the lockdown comes to an end on May 3rd.
Data from our Light Sensor. The Ups and Downs mark the Day and Night. It provides the constant beat in the Musical
But throughout the whole musical, you can hear the constant beat of the Marimba. That represents the passage of days and nights. That is the only thing that did not change after the lockdown period.
The musical is around 30 seconds and represents 15 days of data (26 April – 10th May).
Future of this Project
We plan to continue with this project for some more time to collect enough data for future use and comparison.
It may prove to be useful to measure the effectiveness of subsequent lockdowns in Toronto if there is a second or third wave of COVID19 breakout.
We hope to keep our imagination running free so that we can thinking of other things that change because of a lockdown or other such interventions, and how to measure them.
We would be happy to present the findings of our Project with other organizations, researchers as well as governments.
Science is for everyone. There should be no barriers such as color, age, gender, and abilities in science. If you are curious, and you are willing to work hard then you are already a scientist!
2026 Third Place, Student Oral Competition, NASA Exploration Science Forum, USA. 2025 Third Grand Award, International Science and Engineering Fair, USA. NASA Group Achievement Award 2025 (DART mission team). 2024 Youth Can Innovate Award ($7,000) and Silver Medal, Canada-Wide Science Fair. Gloria Barron Prize for Young Heroes 2024. Eureka Changemakers Fellow 2025. 2023 Second Prize Winner – European Union Contest for Young Scientists (EUCYS). Best of the Fair Award, Gold Medal, Top of the Category, Youth Can Innovate, and Excellence in Astronomy Awards at Canada Wide Science Fair 2023 and 2022. RISE 100 Global Winner, Silver Medal, International Science and Engineering Fair 2022, Gold Medal, Canada Wide Science Fair 2021, NASA SpaceApps Global 2020, Gold Medalist – IRIC North American Science Fair 2020, BMT Global Home STEM Challenge 2020. Micro:bit Challenge North America Runners Up 2020. NASA SpaceApps Toronto 2019, 2018, 2017, 2014. Imagining the Skies Award 2019. Jesse Ketchum Astronomy Award 2018. Hon. Mention at 2019 NASA Planetary Defense Conference. Emerald Code Grand Prize 2018. Canadian Space Apps 2017.
Follow Us on Twitter
Do it Yourself Asteroid Astrometry using Python for Asteroid Apophis
The Masked Scales; 2020 NASA SpaceApps COVID-19 Challenge Global Winners!
Deep Space Musical: NASA SpaceApps 2018 Toronto Winner
LIGO Quadruple Pendulum: Swinging to Stability, Royal Astronomical Society of Canada 2019
TVO Kids (2018): TRAPPIST-1 Sound and Light Model
Lecture on TRAPPIST-1 at Carr Astronomical Observatory (CAO) Open House
Yes I Can / Oui Je Peux: NASA – Canadian SpaceApps Toronto 2017 Winner
Drop the Drought : NASA Space Apps Toronto 2017 Winner