Arushi Nath (10 years) The NASA SpaceApps Challenge 2019 was held from October 18 – 20 this year. It is is one of my favorite hackathons. The first time I […]
Arushi Nath (10 years)
The NASA SpaceApps Challenge 2019 was held from October 18 – 20 this year. It is is one of my favorite hackathons. The first time I participated in it was in 2014 when I was 5 years. Since then I have been participating every year and this was my 6th NASA SpaceApps Challenge.
I won the NASA SpaceApps Toronto in 2014, 2017, 2018 and again this year in 2019 and went to become a global nominee. My project was among the top 25 globally in 2014 and 2018.
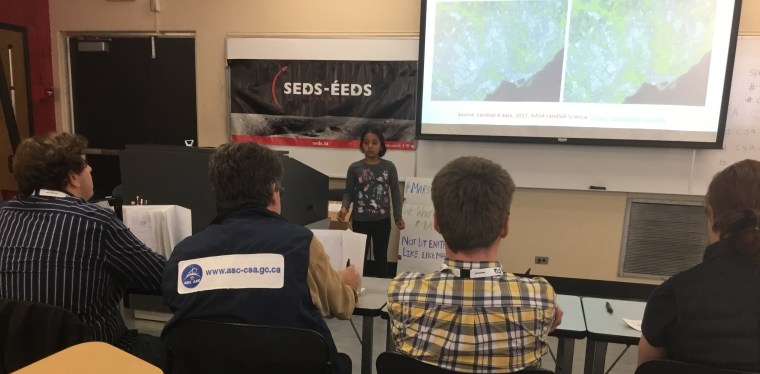
Presenting my project at NASA SpaceApps Toronto 2019 and winning the Hackathon to become the Global Nominee
What I like best about SpaceApps Challenge is that it allows me to work on a cool space-related challenge and then come with a solution that often involves satellites, NASA, music or even arts.
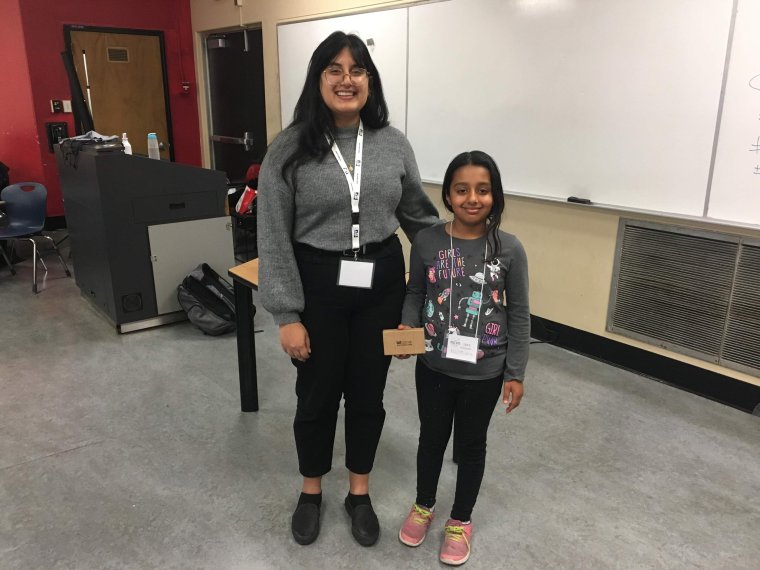
Getting the SpaceApps Toronto 2019 winning prize from Hira Nadeem, President, Students for the Exploration and Development of Space (SEDS) Canada
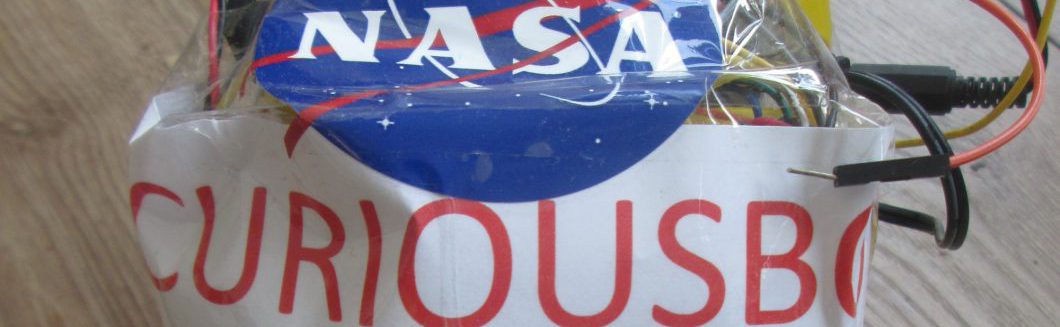
Check out 30 seconds video on my S.N.A.C.K Project
Space and Climate Change: Smash your SDGs
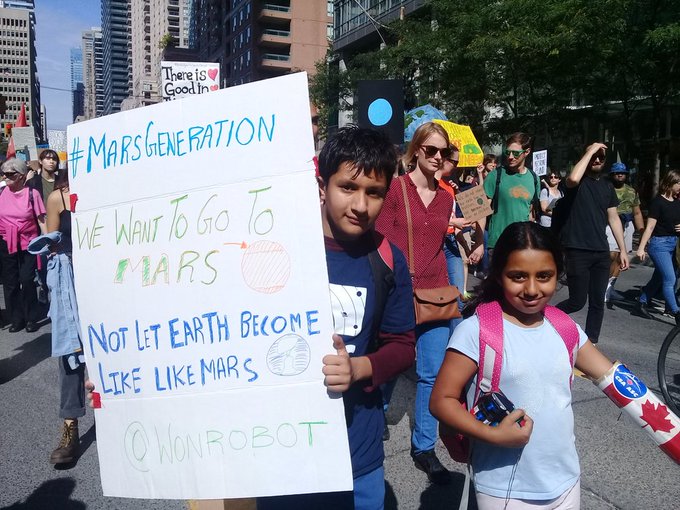
This year I was very much inspired by the voice on climate change raised by Swedish teen and climate activist Greta Thunberg. I even marched in the Climate Strike organized in Toronto as a part of the Global Strike for Climate.
Climate Change affects all of us and I wanted to learn more and do something about it. And what better way to learn more than do a project on climate change. So I ended up selecting the “Smash your SDGs” challenge of the SpaceApps 2019.
I participated in Global Strike for Climate in Toronto. But I wanted to go beyond raising slogans. I wanted younger generation and school students to take action
The challenge was to come up with creative solutions that use Earth observations to address the United Nations’ Sustainable Development Goals and foster sustainable development worldwide. The Smash your SDGs Challenge called for using NASA and other Earth-observing satellites’ data as well as information generated by crowd-sourcing and in-situ measurements to create practical applications related to water, health, food security, and land use issues.
I had previously used data from NASA Satellites and Canadian Satellite (RadarSat-2) so I was comfortable doing this challenge. However unlike previous hackathons where I participated as a family team, this year I decided to participate on my own.
My project: Schools and NASA Aiding Climate Action by Kids (S.N.A.C.K)
During the Climate Strike in Toronto, I saw thousands of other school children also participating in it. It was clear that students and the younger generation are aware of this issue and want action on climate change.
But I wanted to go beyond raising slogans. I wanted school children to come up with local solutions to global challenges. So I started thinking of ways to make my school and city greener. (SDG Goal 11: Sustainable Cities and Communities)
So I ended up coming with my project: Schools and NASA Aiding Climate Action by Kids (S.N.A.C.K) as a step up from climate protests to climate action.
My project uses satellite imagery to rank schools based on their tree densities and maps them. Students can add and share picture of school trees to make their schools greener.
Measuring Tree Densities in School Playgrounds (Satellites, In situ measurement + Crowdsourcing)
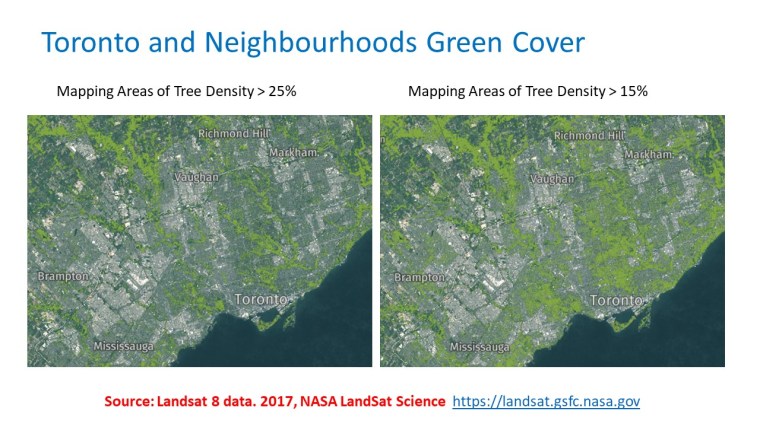
As school playgrounds are small and their tree densities are less than 20% they usually do not figure out in city green cover maps. But it is important to measure and monitor school tree densities as it is the children who use them the most during school hours and even outside of them. Trees in cities and urban areas provide climate, biodiversity and health-related benefits.
As the challenge asked the teams to use (1) satellite data, (2) in situ measurements, and (3) crowdsourcing, I came up with a way to measure tree densities for 15 French-board schools in Toronto combining all three methods.
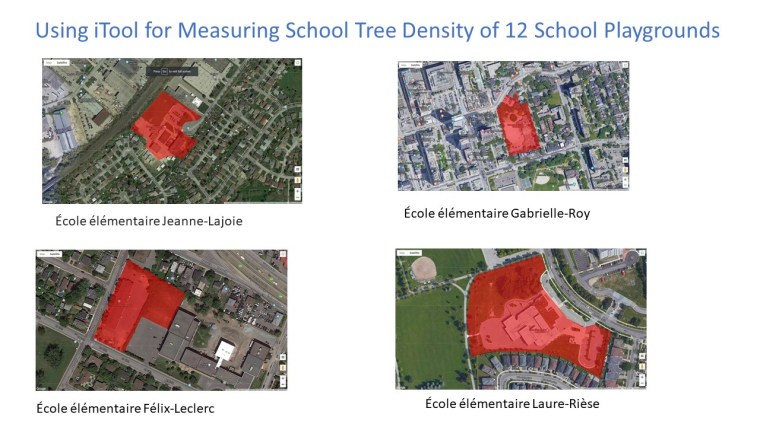
1. I used vegetation data from the NASA Satellite Data (LandSat 8) and i-Tree Canopy Tool provided free of charge by USDA Forest Service to measure the tree canopy area within the school boundary.
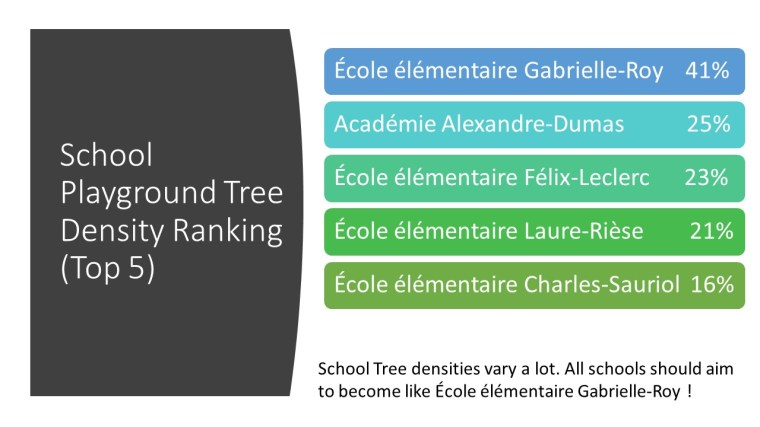
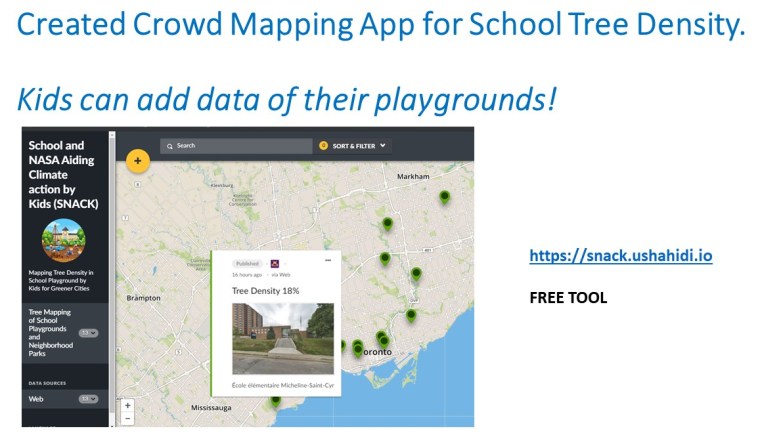
2. I ranked the schools according to their tree densities and the climate benefits provided by the trees and mapped them on a crowdsourcing platform. Students can then check tree densities of their schools and also submit pictures of trees they are planting to make their schools greener.
I ranked Tree Densities in Playgrounds of different schools
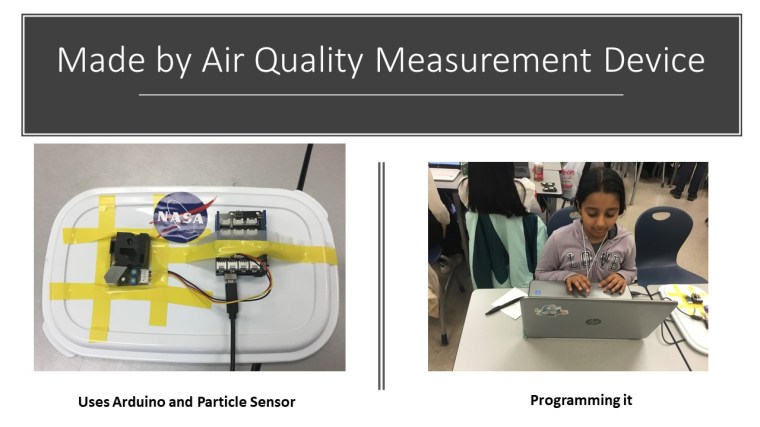
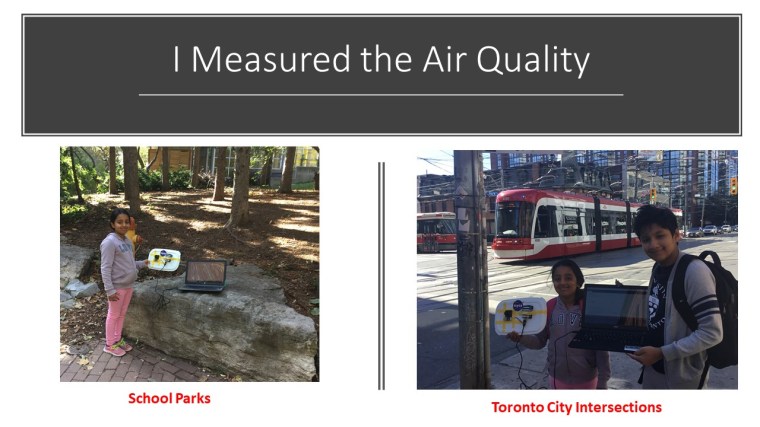
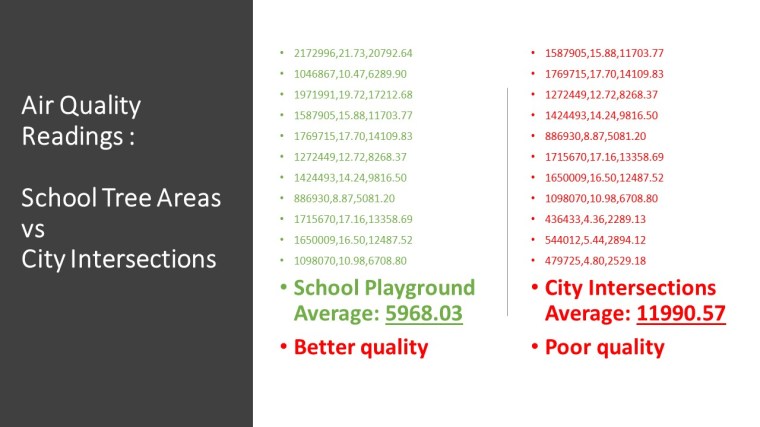
3. I built a pollution sensor in my home using Arduino to measure air quality. I used my Sensor at schools and at busy street intersections to measure the impact of trees in absorbing air pollutants and making our air cleaner.
The pollution sensor costs around CAD 40 to make with parts procured from eBay. And it simple to program it. One could use available libraries for Particle Sensor. A time interval can be programmed for gathering data which could then be easily analysed.
Some children have started using this project. As more and more school children participate in this project, we can create a crowd map of school parks and their tree densities.
The crowd map of School Tree data can be viewed at http://snack.ushahidi.ioYou can add data too! I thank Ushahidi for offering free use of their software for this project.
This action by school students will play an important role in moving from School Strikes to School Action on Climate Change.
Conclusion
From my project, it was clear that school parks matter. They may be small in area but they are used by lots of children during school hours and after school. While some schools have high tree densities others do not.
If all the schools in Toronto could aim to achieve the same tree density as Ecole Elementaire Gabrielle-Roy which currently has 41% tree density then we would increase our tree population and climate benefits.
I am planning to expand this project to more schools and involving more students in 2020.
2025 Third Grand Award, International Science and Engineering Fair, USA. 2023 Second Prize Winner – European Union Contest for Young Scientists (EUCYS). Best of the Fair Award, Gold Medal, Top of the Category, Youth Can Innovate, and Excellence in Astronomy Awards at Canada Wide Science Fair 2023 and 2022. RISE 100 Global Winner, Silver Medal, International Science and Engineering Fair 2022, Gold Medal, Canada Wide Science Fair 2021, NASA SpaceApps Global 2020, Gold Medalist – IRIC North American Science Fair 2020, BMT Global Home STEM Challenge 2020. Micro:bit Challenge North America Runners Up 2020. NASA SpaceApps Toronto 2019, 2018, 2017, 2014. Imagining the Skies Award 2019. Jesse Ketchum Astronomy Award 2018. Hon. Mention at 2019 NASA Planetary Defense Conference. Emerald Code Grand Prize 2018. Canadian Space Apps 2017.