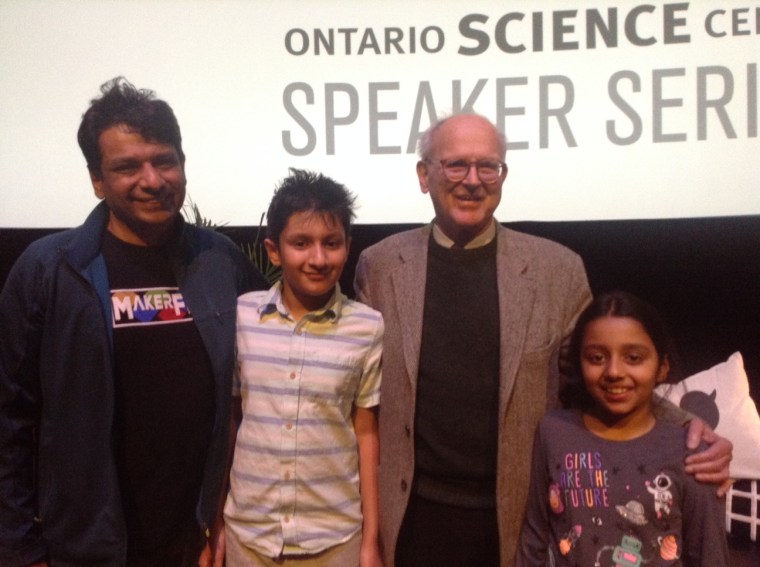
On 28 November 2018, we attended a lecture given by Dr. Rainer Weiss (2017 Nobel Prize Winner for Physics) at the Ontario Science Centre, Toronto. The lecture was about his work […]
On 28 November 2018, we attended a lecture given by Dr. Rainer Weiss (2017 Nobel Prize Winner for Physics) at the Ontario Science Centre, Toronto. The lecture was about his work with the Laser Interferometer Gravitational-Wave Observatory (LIGO). The beauty of Dr. Weiss’s lecture on discovering Gravitational Waves from colliding black holes and neutron stars using LIGO was in its simplicity and elegance, and it captured our imagination.
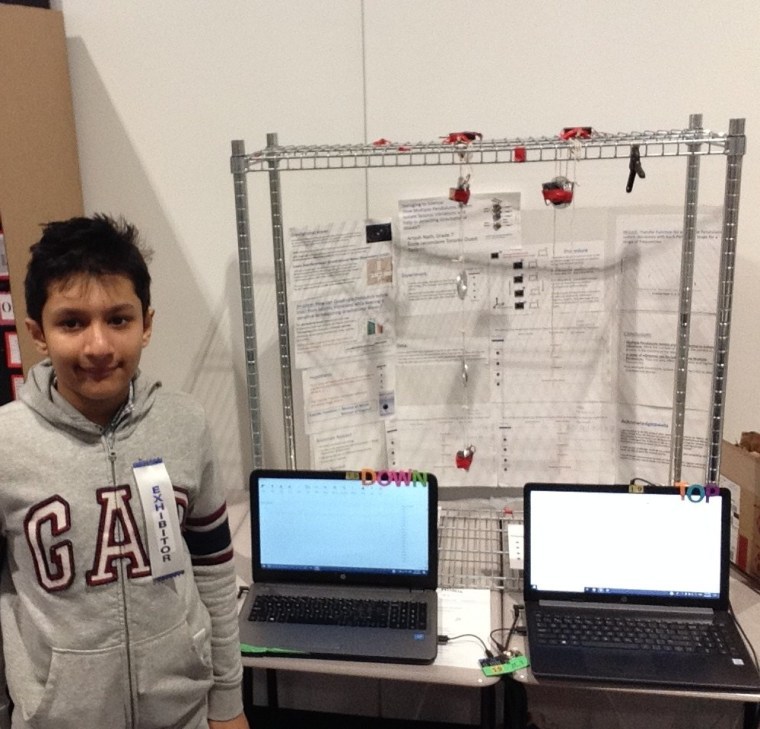
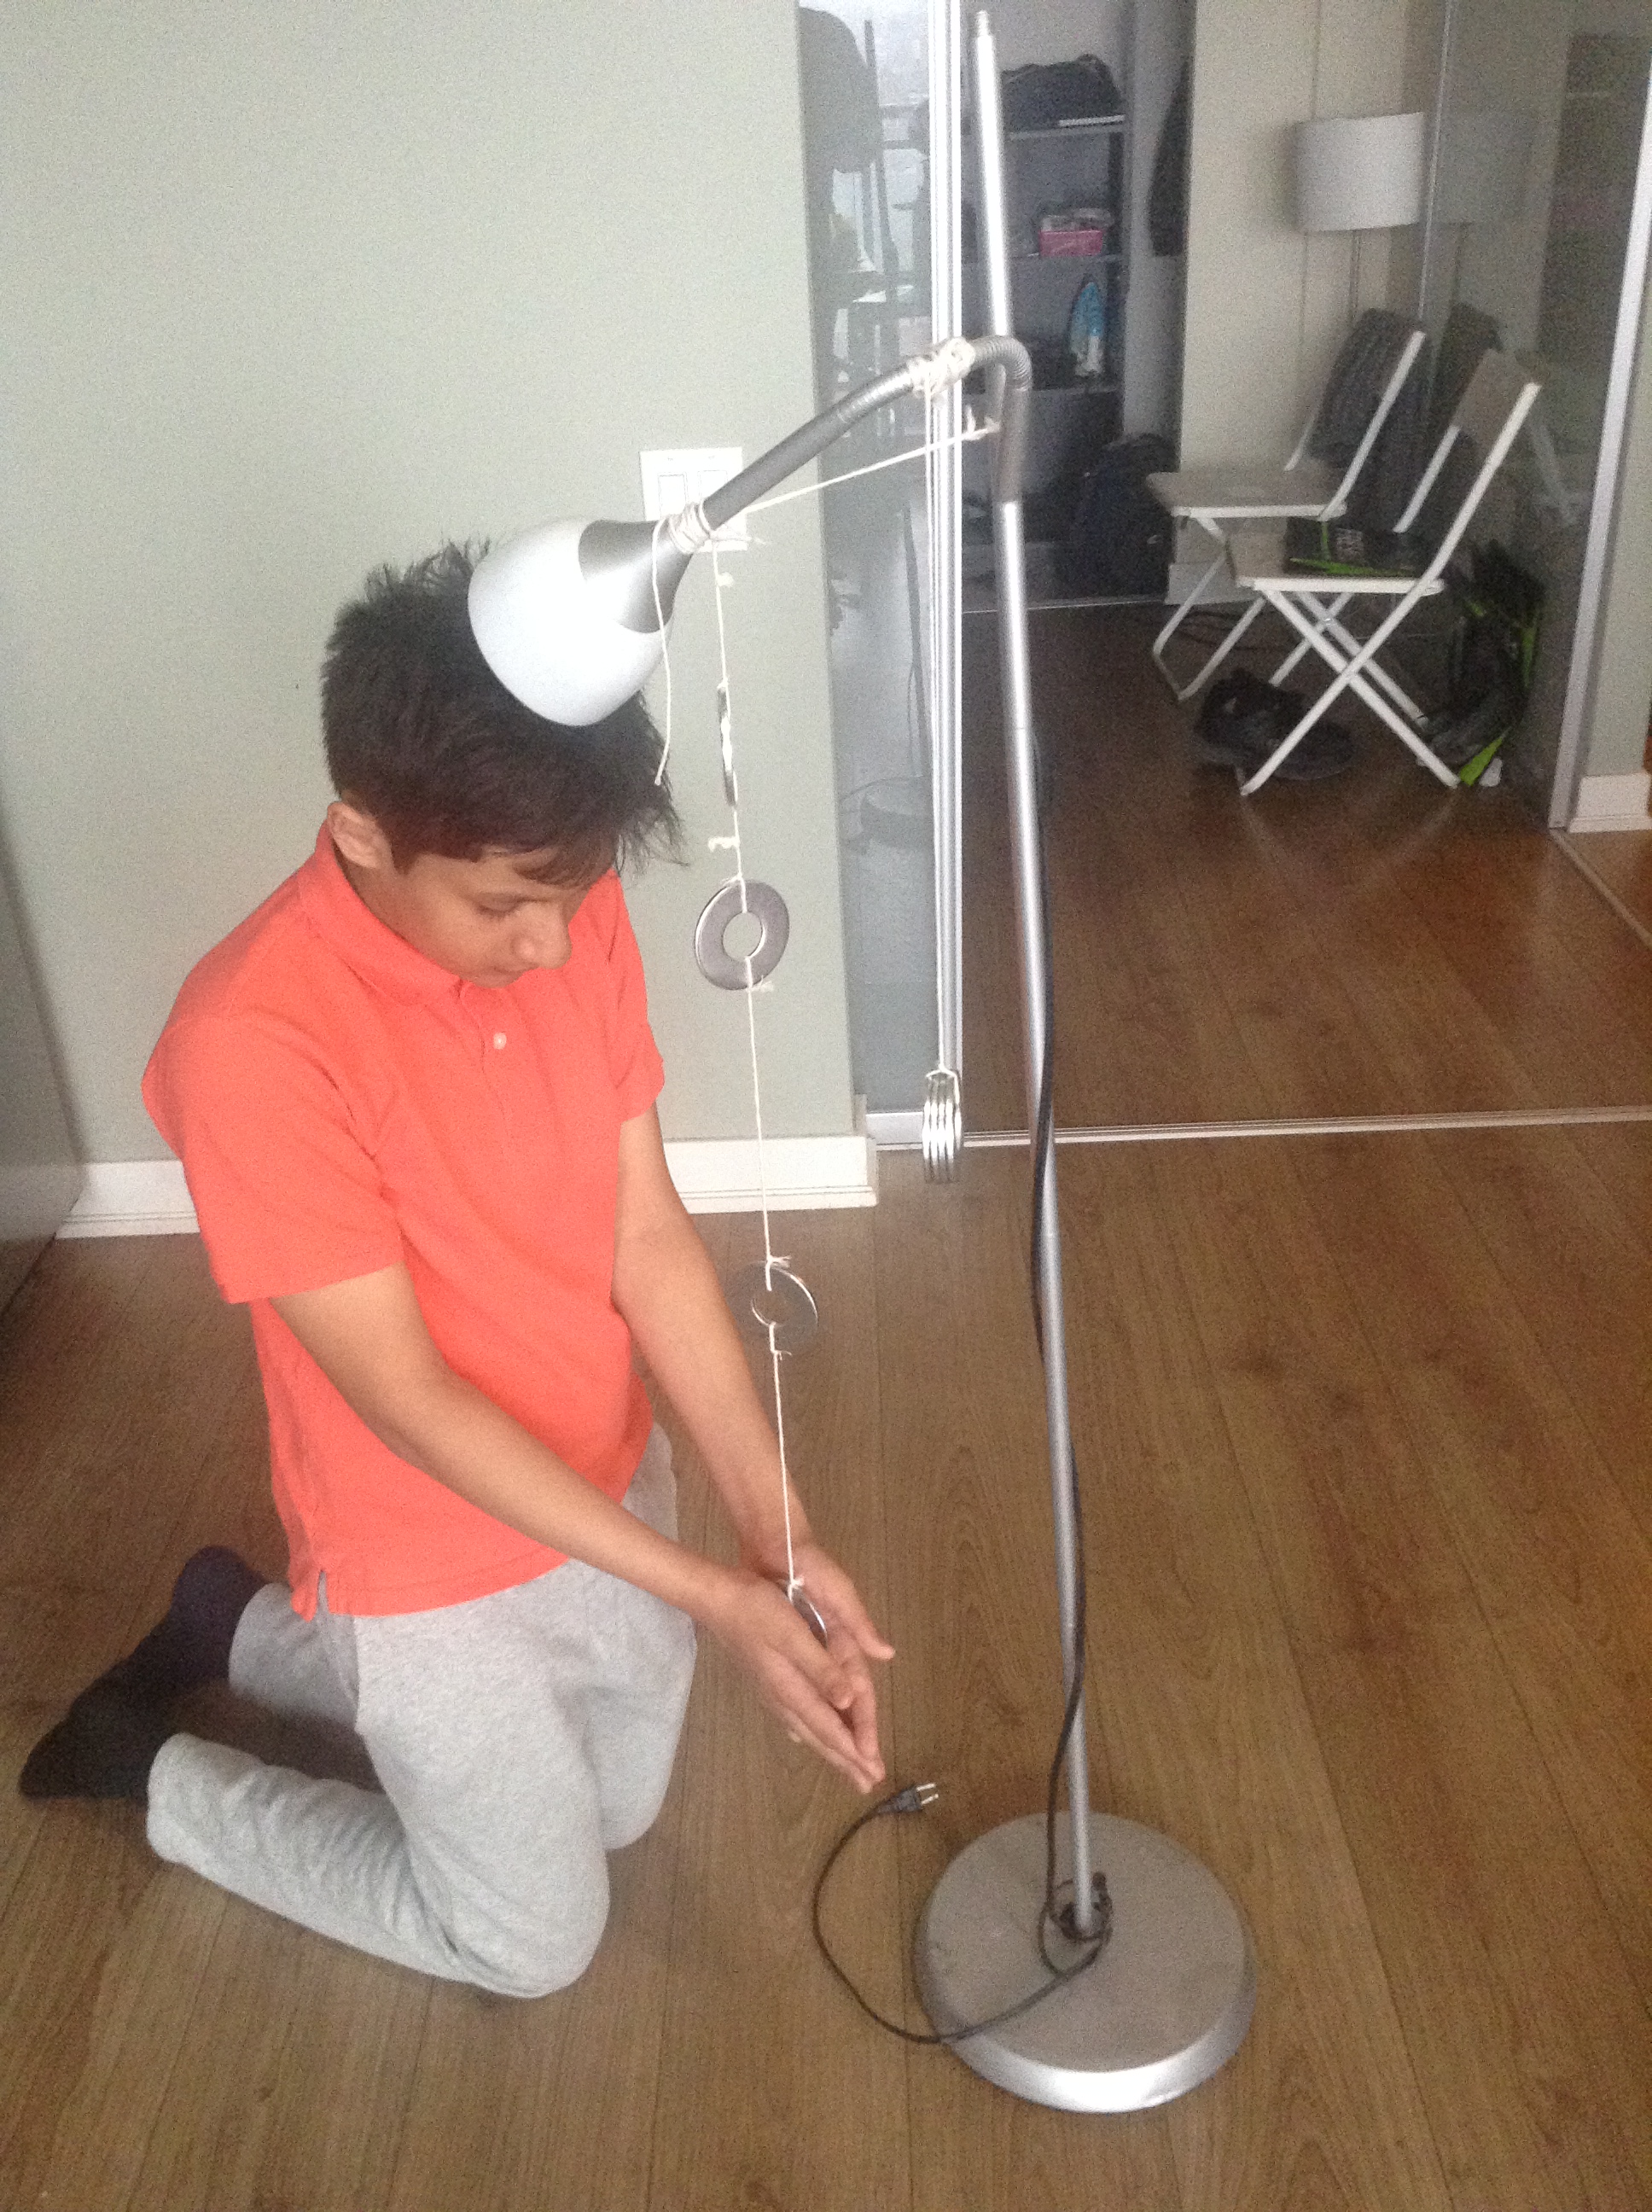
Artash (Grade 7) with his homemade experiment on LIGO’s Quadruple Pendulum
Gravitational Waves
Source: LIGO/CalTech website
Gravitational waves are ripples in the curvature of spacetime produced by some of the most powerful events in the universe – colliding black holes and neutron stars, supernova explosions, and even birth of the universe.
They were predicted by Albert Einstien in 1916. 99 years on 14 September 2015 they were first discovered by the most sensitive instrument in the world – the LIGO. The event [GW150914] wasfrom the merger of a binary black hole. Over a time span of 0.2 seconds, it briefly emitted more energy than all the stars in the observable Universe combined. That is the kind of energy needed to make gravitational waves strong enough to detect. And these waves have been traveling towards us for over a billion years.
The discovery of gravitational waves brought joy to many scientists and engineers behind the LIGO who had waited decades for this news. Not only do we stand on the shoulder of giants but we also hold hands with countless engineers, mathematicians, and scientists who conceive and design the instruments that led to scientific discoveries.
What is Laser Interferometer Gravitational-Wave Observatory (LIGO)?
LIGO Layout (Source: Source: Sky and Telescope Magazine, Feb 2016)
LIGO comprises of L-shaped laser interferometers with arms up to 4 km long and placed thousands of kilometers apart but working as a single “observatory”: one in southeastern Washington State and the other in rural Livingston, Louisiana. When Gravitational Waves pass through them they stretch and compress by a tiny amount. By lining up lasers and observing changes in interference patterns, LIGO is able to detect gravitational waves. In absence of gravitational waves, the laser beams traveling in the two arms arrive at a photodetector exactly 180° out of phase, yielding no signal. But when a gravitational wave propagates perpendicular to the detector plane it disrupts this perfect destructive interference and a measurement is made by the photometer.
The first LIGO event [GW150914] compressed and expanded LIGO’s arms by 10 to the power of -19 meters or around 1/10,000 of the diameter of a proton.
Problem: How can Quadruple Pendulum isolate LIGO from Seismic Vibrations while keeping it sensitive to measuring Gravitational Waves?
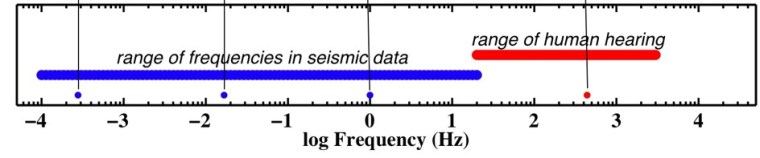
Gravitational waves cover a wide range of frequencies (Source: Sky and Telescope Magazine, Feb 2016)
The gravitational waves detected by LIGO range in frequency from tens of hertz to a few hundred hertz. This overlaps with the frequency of seismic vibration caused by ocean waves, earthquakes, tides, weather pattern, and traffic.
To isolate from Seismic vibrations, advanced LIGO suspends it mirrors (test mass) on Quadruple Pendulum. This makes them 10 to the power of 9 times quieter than the ground. The suspended mirrors act as Free Masses that can be displaced by Gravitational Waves.
Dr. Rainer Weiss in his lecture talked about quadruple pendulums or four pendulums stacked one below the other. LIGO uses such pendulums to isolate its mirrors from seismic vibrations.
He encouraged the audience to make a quadruple pendulum using washers and strings to see for themselves how they worked. We took up this challenge and planned an experiment around it. The best way to learn science is by doing an experiment.
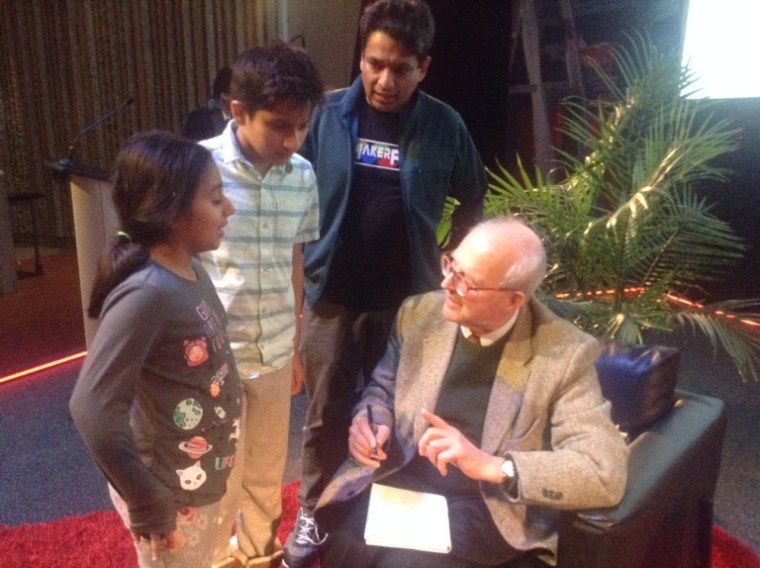
With Dr. Rainer Weiss, Ontario Science Centre, 28 November 2018
OUR EXPERIMENT
The hypothesis we wanted to test was that for a range of frequencies, each pendulum in a quadruple pendulum vibrates less than the one above it.
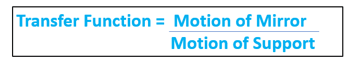
We defined our Transfer Function based on horizontal acceleration experienced by weights on each pendulum to calculate the motion transferred from the top support of the pendulum to the pendulums below. This is because acceleration is a valid measure for change in motion.
Experiment Set up
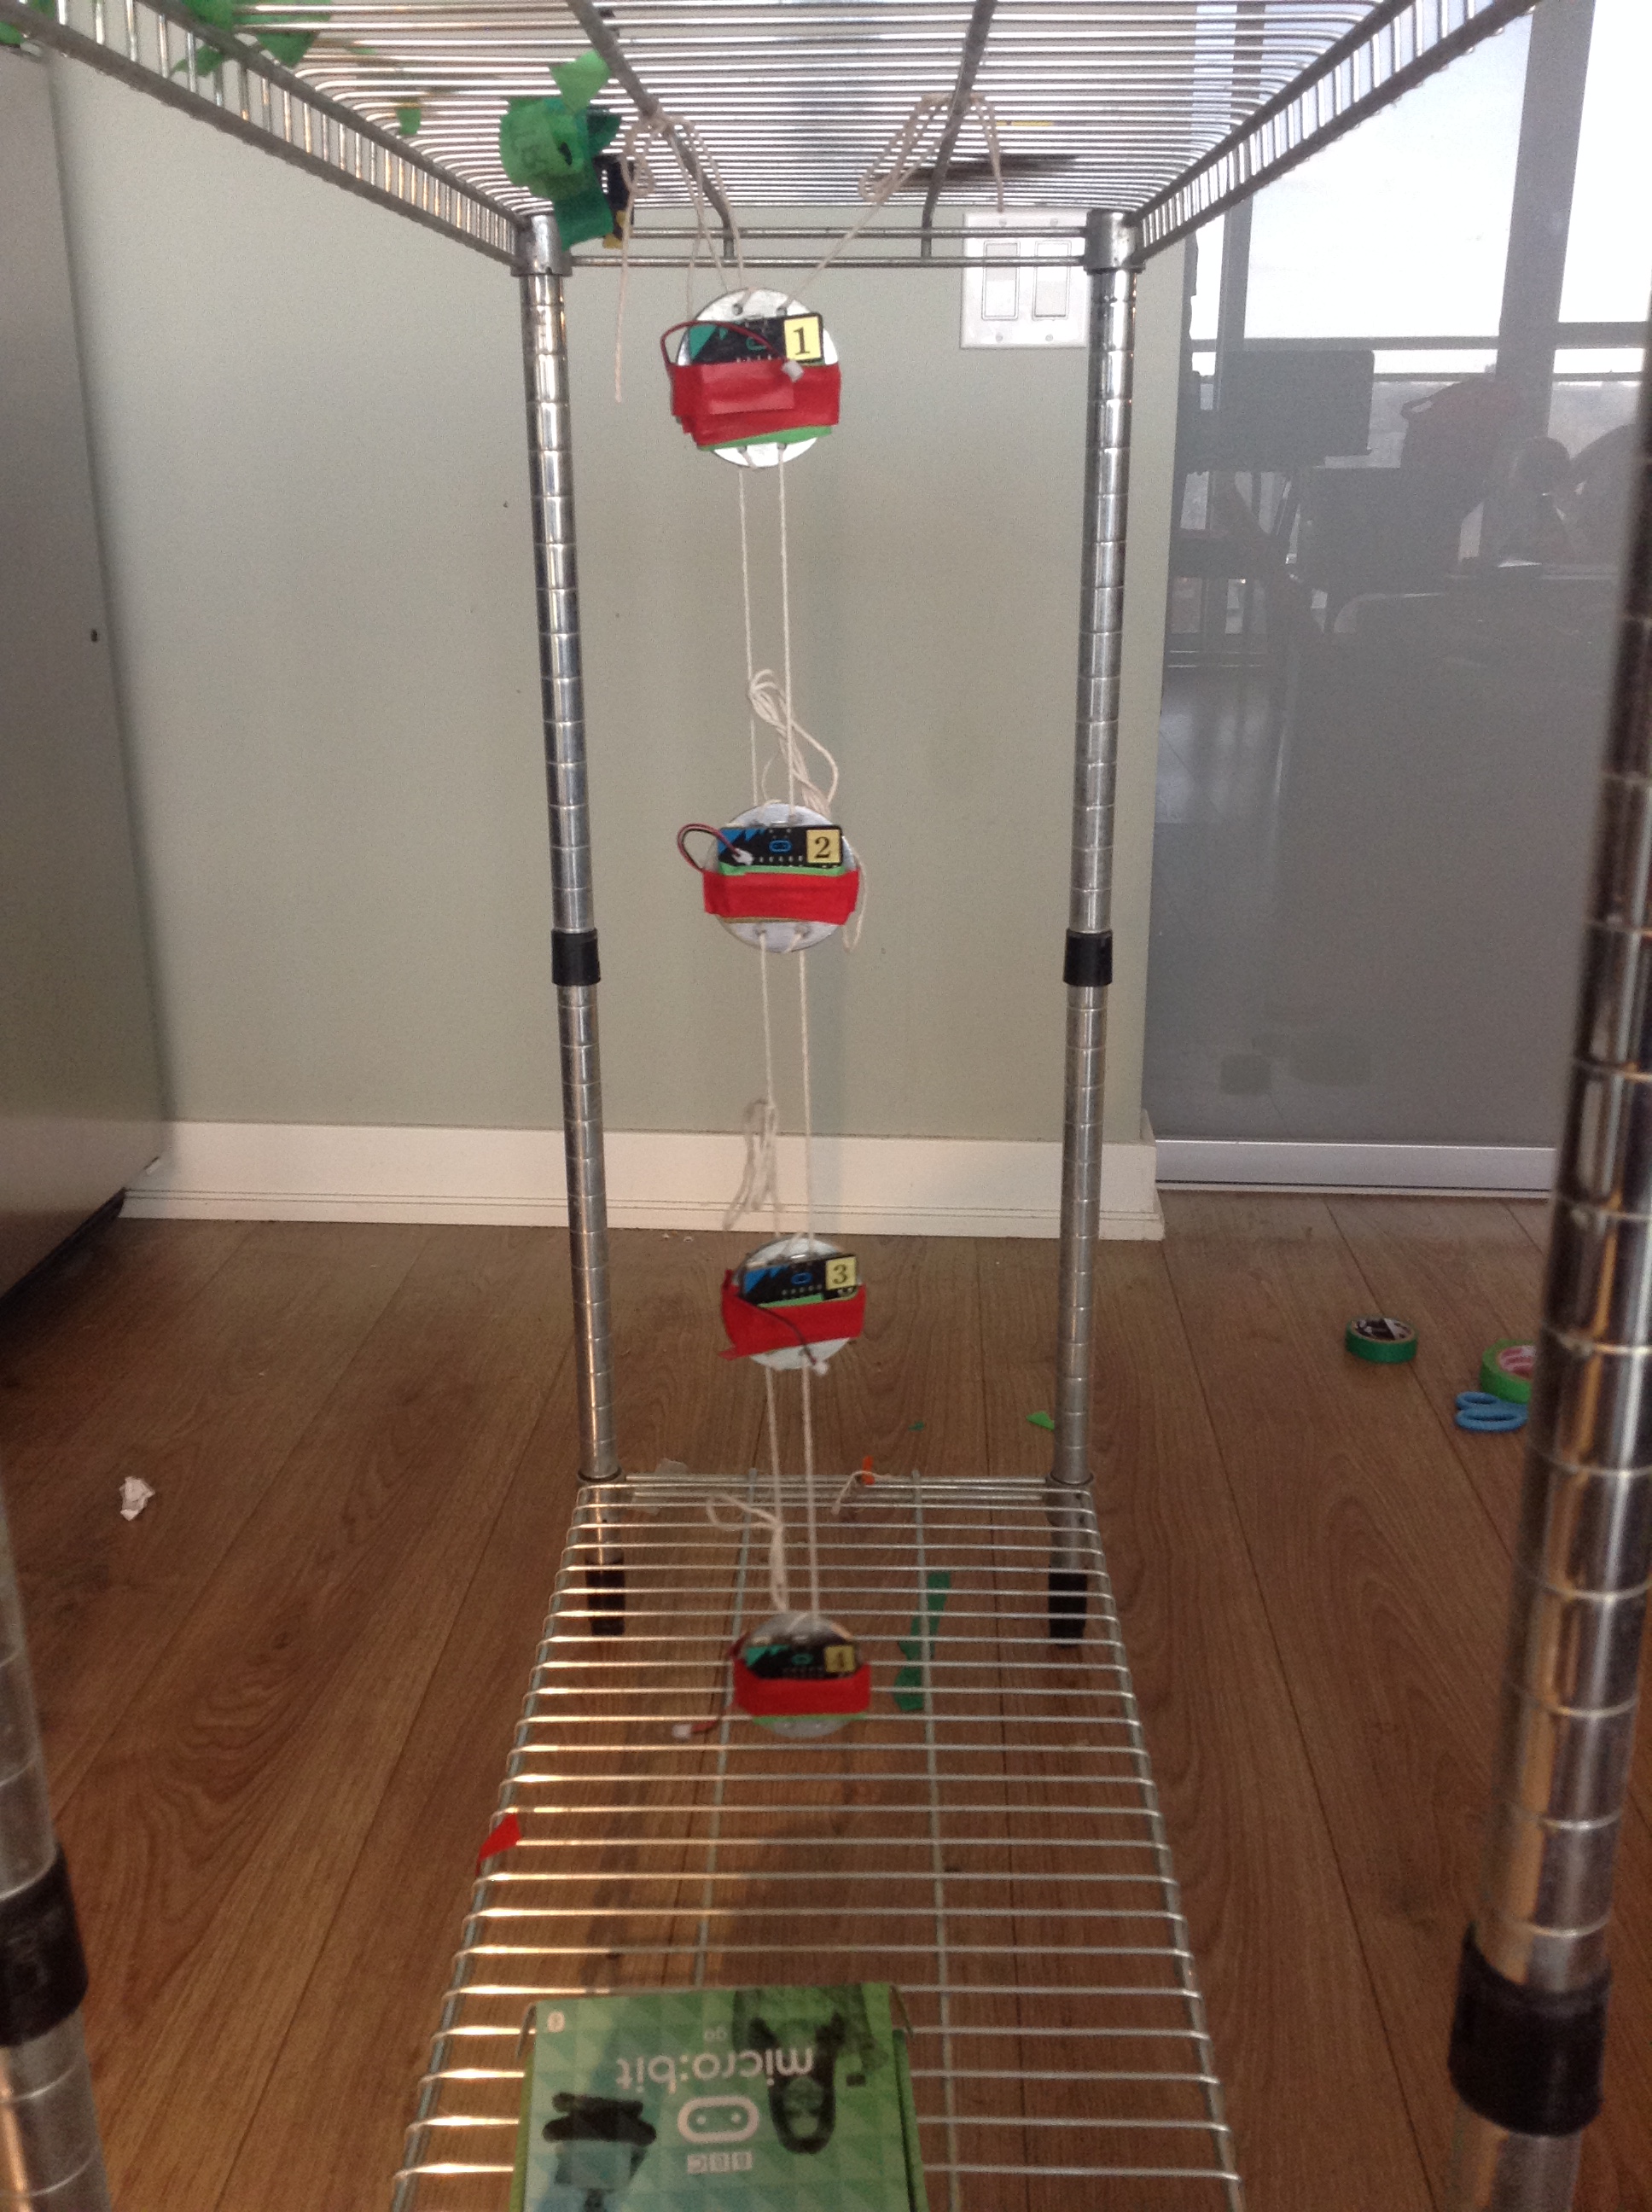
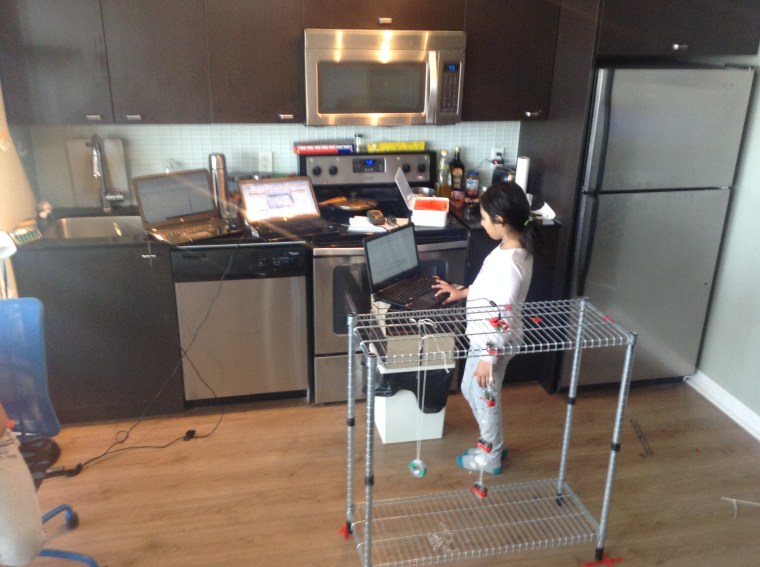
1. Create a 4 stage pendulum set using washers and string. The masses are attached every 20 cm.
2. Measure horizontal acceleration (change in motion) at test masses using an accelerometer for a range of frequencies to calculate the Transfer Function.
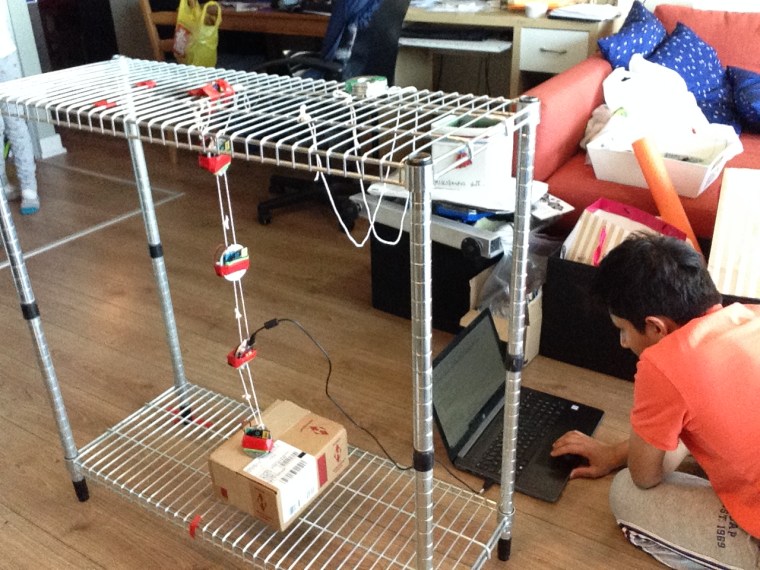
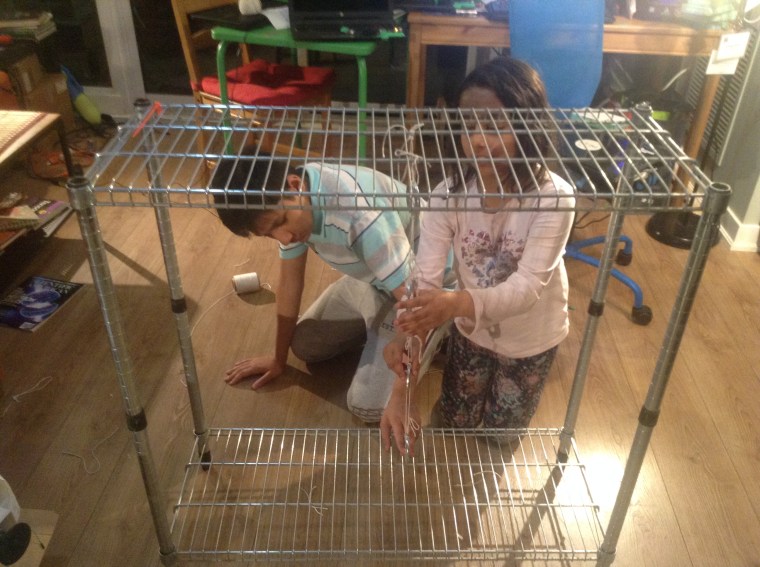
The first version of our experiment. It did not work but we learned what we needed to do to make it work (just like initial LIGO) so we decided to upgrade it.Attaching micro:bit to each pendulum to measure horizontal acceleration
Materials Needed for the Experiment
8 heavy washers and string
10 Micro:bit processors (Accelerometer + Radio Transmitter & Receiver)
Vibrating devices of different frequencies
Frequency Measurement meter (piezoelectric)
Computers / Laptops
The second version of our experiment. This time we used an IKEA shelf to create a quadruple pendulum which had dual strings on each weight to prevent rotation
Procedure
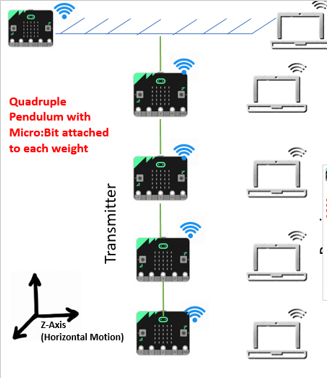
The top most micro:bit measures induced vibrations. The subsequent four micro:bits measure the acceleration of each pendulum with the bottom most pendulum (Pendulum 4) measuring acceleration of the test mass.
The topmost micro:bit measures induced vibration. Followed by four more micro:bit measuring acceleration of each pendulum. The bottommost is the test mass (Pendulum 4)
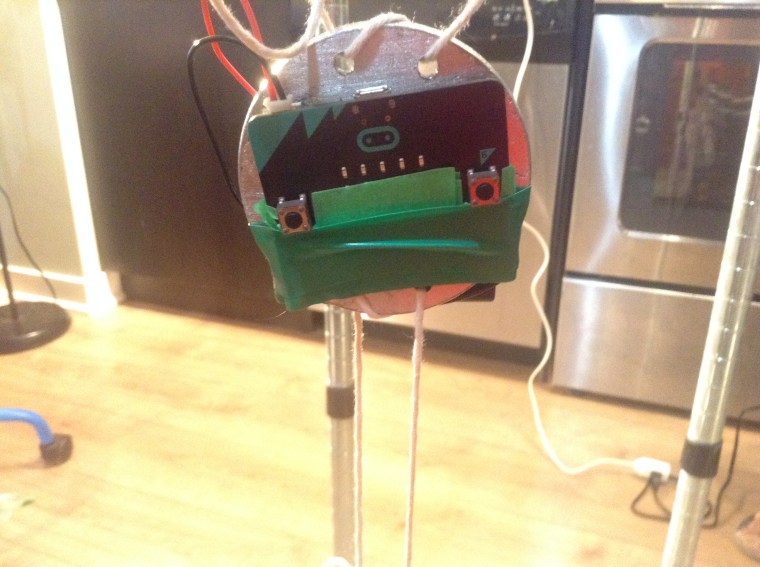
Fixed a micro:bit on the top base of the pendulum to measure horizontal acceleration before it got transferred to the pendulum
Fixed Micro:bit processors on each of the 4 pendulum stages to measure acceleration along the z-axis (horizontal axis).
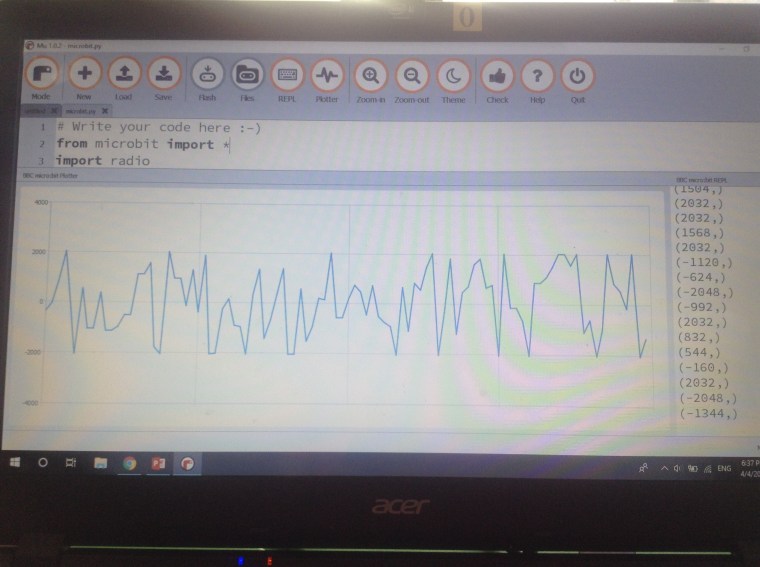
Micro:bit were programmed in Python to transmit data wirelessly every 100 ms.
Each Micro:bit had a dedicated wireless receiver so that data was received simultaneously without latency.
The Quadruple Pendulum was acted upon by external vibration by 3 devices of different frequencies: Back Massager (low frequency), Cordless Drill (medium frequency) and Corded Drill (high frequency).
Micro:bit added to all the pendulums. They will transmit data wirelessly to the receiver micro:bit over dedicated channels
Data Gathered
Each experiment was repeated 3 times to get stable data. A baseline data was first taken for each of the pendulum stages. External vibrations were then induced to the top base of the pendulum for at least 60 seconds. 10 data points were collected for each pendulum stage every second. Over 45,000 data points were collected which were analyzed and graphed.
Calibrating each of the micro:bit to transmit dataMicro:bit at the top base of the pendulum measuring induced vibrationsMicro:bit at the bottom of the pendulum (Pendulum 4 or test mass) showing minimal movementArushi (Grade 4) monitoring acceleration data being received on five computers during the experiment.
RESULTS FROM THE EXPERIMENT
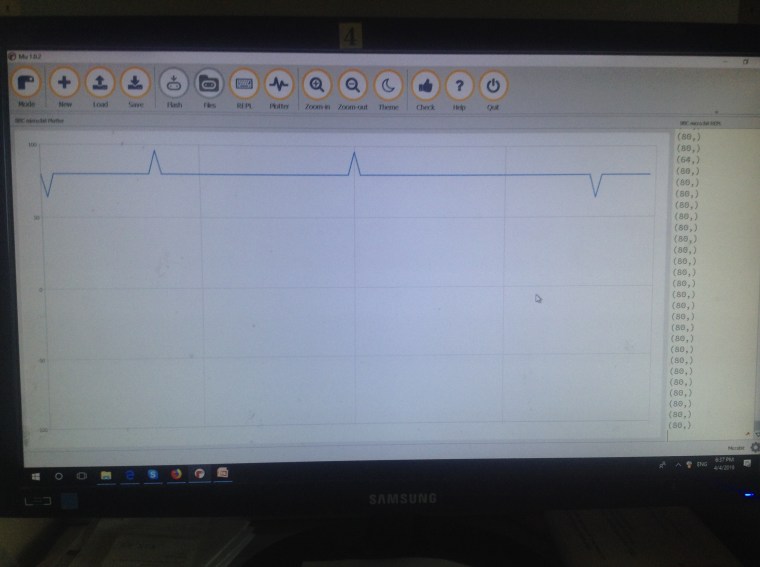
We graphed 10 readings for each of the experiment. The first 5 readings were baseline readings from the top base of the pendulum (or the support) followed by readings from Pendulum 1, Pendulum 2, Pendulum 3, and the bottom most Pendulum 4 (or the test mass). The other 5 readings were taken after inducing vibrations. See the graphs obtained below.
In each of the cases, the acceleration experienced decreased from top to bottom pendulums.
For Low Frequency (base horizontal acceleration: 0.15 g)
The vibrations got transferred from base to pendulum 1. But there was very little change from Pendulum 2 onwards. Pendulum 4 (or the test mass) remained absolutely still.
For Medium Frequency (base horizontal acceleration: 1.2 g)
The vibrations got transferred from base to pendulum 1 and pendulum 2. But there was very little change from Pendulum 3 onwards. Pendulum 4 (or the test mass) remained very still.
For High Frequency (base horizontal acceleration: 2 g)
This was a really violent vibration. The vibrations got transferred from base to up to pendulum 4. Nevertheless, acceleration experienced by the pendulum 4 was very minimal compared to vibrations of pendulums above it.
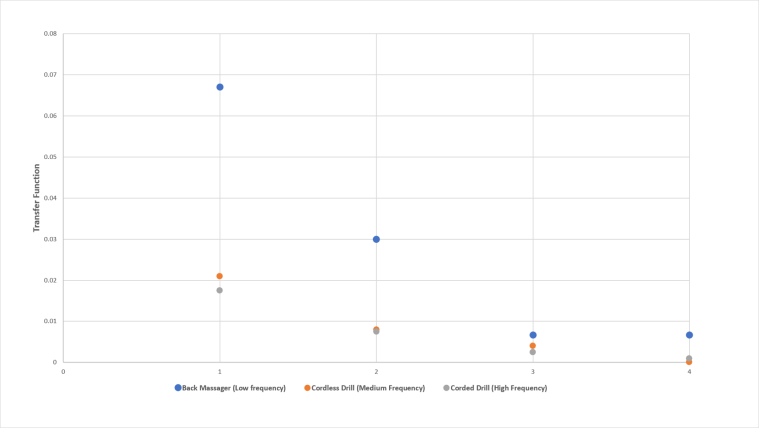
“Transfer Function” Analysis and Plot
We used the data gathered to analyze the transfer function at each stage of the pendulum. To do so, we took the highest value of acceleration measured rather than the average. Taking the highest value meant we wanted to consider maximum disturbance experienced at each stage. From this value, we subtracted the maximum acceleration recorded during baseline measurement for that stage.
TRANSFER FUNCTION SHEET (Pendulum Motion / Base Motion)
Base Acceleration (1000 unit = 1 g)
Pendulum 1
Pendulum 2
Pendulum 3
Pendulum 4
Back Massager (Low Frequency)
150
0.067
0.03
0.0067
0.0067
Cordless Drill
(Medium Frequency)
1200
0.021
0.008
0.004
0.0001
Corded Drill
(High Frequency)
2000
0.0175
0.0075
0.0025
0.001
From plotting the results of the transfer function vs. pendulum stage, it was clear that in all the 3 cases, the transfer function value decreased for each subsequent stage and approached zero for stage 4. It implies that vibrations transferred were minimal from pendulum stage 1 to stage 4 for a range of induced vibrations.
Furthermore, the transfer function had a higher value for lower frequency vibrations as compared to higher frequency ones. It meant that the quadruple pendulum was very efficient in isolating higher frequency vibrations.
Transfer Function Plot
CONCLUSIONS
Multiple stage pendulums are very effective in isolating vibrations. More the number of chains in the pendulum, the greater is the stability of the test mass.
More stages pendulum can detect more Gravitational Waves including those with lower frequencies such as massive star binaries.
After the experiment, it became clear to us how the quadruple pendulum works and why it is used in LIGO. To increase the sensitivity of the instrument it is always possible to increase the pendulum stages.
We thank Dr. Rainer Weiss once again for the challenge and inspiration behind this experiment.
Science happens where there is curiosity. Learning happens by “doing”. Perseverance comes with encouragement and opportunities.
Arushi (Grade 4) stabilizing the pendulum after each experiment
fff
Thank you Prof. Rainer Weiss for being a teacher to all of us
2026 Third Place, Student Oral Competition, NASA Exploration Science Forum, USA. 2025 Third Grand Award, International Science and Engineering Fair, USA. NASA Group Achievement Award 2025 (DART mission team). 2024 Youth Can Innovate Award ($7,000) and Silver Medal, Canada-Wide Science Fair. Gloria Barron Prize for Young Heroes 2024. Eureka Changemakers Fellow 2025. 2023 Second Prize Winner – European Union Contest for Young Scientists (EUCYS). Best of the Fair Award, Gold Medal, Top of the Category, Youth Can Innovate, and Excellence in Astronomy Awards at Canada Wide Science Fair 2023 and 2022. RISE 100 Global Winner, Silver Medal, International Science and Engineering Fair 2022, Gold Medal, Canada Wide Science Fair 2021, NASA SpaceApps Global 2020, Gold Medalist – IRIC North American Science Fair 2020, BMT Global Home STEM Challenge 2020. Micro:bit Challenge North America Runners Up 2020. NASA SpaceApps Toronto 2019, 2018, 2017, 2014. Imagining the Skies Award 2019. Jesse Ketchum Astronomy Award 2018. Hon. Mention at 2019 NASA Planetary Defense Conference. Emerald Code Grand Prize 2018. Canadian Space Apps 2017.
Follow Us on Twitter
Do it Yourself Asteroid Astrometry using Python for Asteroid Apophis
The Masked Scales; 2020 NASA SpaceApps COVID-19 Challenge Global Winners!
Deep Space Musical: NASA SpaceApps 2018 Toronto Winner
LIGO Quadruple Pendulum: Swinging to Stability, Royal Astronomical Society of Canada 2019
TVO Kids (2018): TRAPPIST-1 Sound and Light Model
Lecture on TRAPPIST-1 at Carr Astronomical Observatory (CAO) Open House
Yes I Can / Oui Je Peux: NASA – Canadian SpaceApps Toronto 2017 Winner
Drop the Drought : NASA Space Apps Toronto 2017 Winner