We presented the analysis of the observations taken by our Solar-X device during the Total Solar Eclipse on 15 November at the Royal Astronomical Society of Canada organized Recreational Astronomy […]
We presented the analysis of the observations taken by our Solar-X device during the Total Solar Eclipse on 15 November at the Royal Astronomical Society of Canada organized Recreational Astronomy Event at the Ontario Science Centre. https://rascto.ca/content/recreational-astronomy-night-45
Between 19 – 23 August 2017, we were at Carbondale in Illinois, USA with our home-made instrument- “Solar-X” to take solar measurements during the 2017 Total Solar Eclipse on 21 August 2017.
Analysis of data gathered by the Solar-X on 21 August Solar Eclipse
After months of preparation, we were ready to deploy Solar-X to understand changes in solar radiation received by the Earth during the solar eclipse. These would include changes in visible light, infrared, and ultraviolet light, as well as the solar power output. Our Solar-X device was fully capable of measuring all these changes and beyond – including changes in temperature, humidity, and pressure.
Deployment of Solar-X and other instruments (Thermometer, Solar Binoculars, Helium Balloon – to estimate wind direction and speed) during the Total Solar Eclipse at Carbondale, USA
Project Objectives
Testing Solar-X at Carbondale under the shade of Salukis at the South Illinois University, Carbondale, USA
Measuring the changes occurring during the solar eclipse have scientific value in understanding our planet Earth as well as for solar system exploration. For instance, changes in radiation received can give us a better understanding of much heat is absorbed by the Earth and how much is radiated back into space. This is useful in getting a better understanding of climate change – for instance, how quickly the Earth cools down when the solar radiation is blocked.
It could also help Astronauts going in for deep space exploration – as they will have a better understanding of temperature and solar output changes during Eclipses. Eclipses would have an impact on the design of spaceships, space settlements, and spacesuits.
Solar-X Design and Making
Design of Solar-X started with pencil and paper
Our design and blueprint of Solar-X device started with our imagination and the questions we had in our minds. We started by creating a blueprint for the project using paper and pencil.
We wrote down all the questions we had in our mind in our notebooks. For instance, how much would the brightness decrease as the eclipse progresses? Will there be any change in the surrounding temperature? Do UV rays coming from the Sun get affected during the eclipse, and lots of other questions.
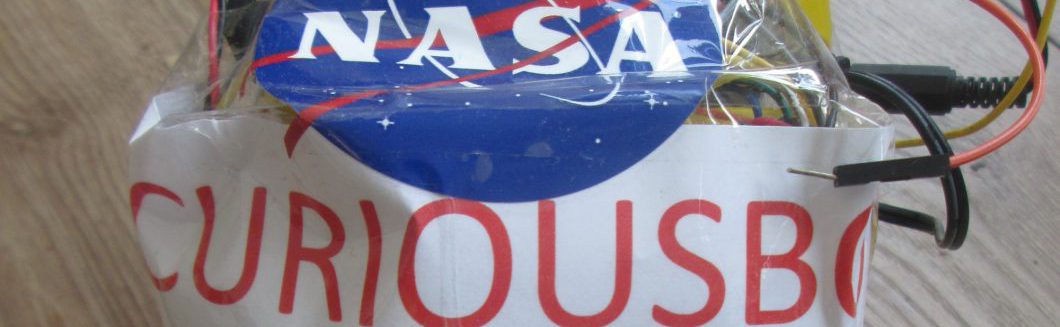
Solar-X being built up from a Lunch Box with sensors on the top
It was followed by building it up at home. We started with a Lunch Box as the base structure of the Solar-X. We then outfitted the Lunch Box with Sensors, Arduino, Real-time Clock, Solar Cell, SD Card Module and Power Source.
This was followed by hours and hours of gathering the full set of data at different locations and under different circumstances, including in shade and direct sunlight. This helped us assess the sensitivity of our device.
Coding of individual components of Solar-XArtash testing and calibrating the individual sensors
In Carbondale, USA for the Total Solar Eclipse
Our Solar-X arrived at the Southern Illinois University, Carbondale.
Unfortunately, the Total Solar Eclipse totally bypassed Canada. Thus we decided to travel down South to Carbondale in Illinois, USA. Carbondale would experience the Totality of the longest duration for the 2017 Solar Eclipse- for two minutes and 40 seconds.
We were aware that those in the path of the totality would see the Sun’s tenuous atmosphere – the corona, possibly prominence, and some bright stars and planets. The daytime would turn to nighttime and during the period of totality, we would be able to look up at the sun (completely blocked by the Moon) with a naked eye. This would not be possible at any other time. Incidentally, the next total Solar Eclipse in North America will also pass through Carbondale – in 2024!
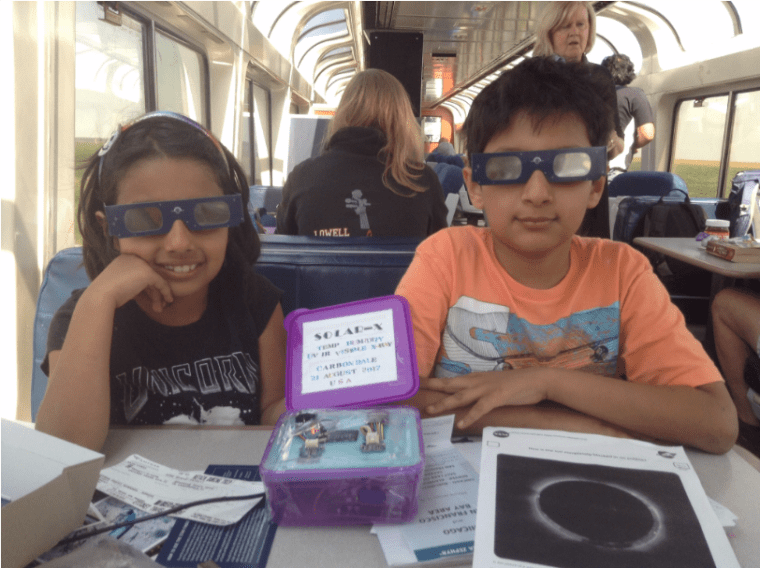
Our Pop-Up Solar Eclipse booth on the Amtrak Train on our way to Carbondale!
At Carbondale, we scouted out various sites and tested our Solar-X. We simulated the solar eclipse by putting the device in the sun and then slowly moving it to shade. It worked perfectly well and it was able to record minute changes in different parameters. The only thing we had to modify was the clock to account for the time difference between Toronto and Carbondale.
Table: Parameters Solar-X can Measure, the Sensors and Units of Measurements
Measurements
Sensors
Units
Temperature
Grove IMU 10DOF
Centigrade
Humidity
Grove IMU 10DOF
Percentage
Pressure
Grove IMU 10DOF
Pascals
Visible Light
Si1145
Lumens
Infrared
Si1145
Lumens
Ultraviolet
Si1145
UV-Index
Solar Output
Solar Cell
Volts
Data Storage
SD Card Module
Time Stamp
Real-Time Clock Module
Base Line Data and Sampling Rate
Collecting Baseline Data 2 days prior to the Solar Eclipse
In preparation for the total solar eclipse, we started to collect baseline data two days prior to the 21 August 2017 total solar eclipse. This would give us comparable data to measures changes happening during the Solar Eclipse.
Our sampling rate was 1 second. This meant that Solar-X would take measurements of all the parameters every second. This may seem too fast for normal days, however, during the solar eclipse when changes start to occur quickly, this sampling rate would provide us with more accurate data.
Solar-X had a built-in power source, SD card data storage, and real-time clock. This meant it ran autonomously while we took other observations during the eclipse.
Data Analysis
We had collected over 20,000 data lines with over 140,000 individual measurements using Solar-X. We used Excel for analyzing the data. We used statistical tools to remove the extraneous readings and reduce the errors in our analysis.
Findings and Interpretations
From beginning to the end, the solar eclipse lasted about three hours. It started when the Moon touched the Sun and took its first tiny nibble out of the solar disk (the First Contact). During the next hour or so, the Moon blocked more and more surface of the Sun. And then there was the totality (between Second and Third Contact). And finally, when the Moon stopped blocking the Sun (the Fourth Contact), the totality was over.
Table: Changes in Key Parameters during the Total Solar Eclipse
Measurements
Before First Contact
During Totality
After Last Contact
Change (%)
Visible Light (Lumens)
400
260
405
35%
Infrared Light (Lumens)
2000
250
2025
87.50%
Temperature (Centigrade)
34
30.5
34.5
10%
Solar Power Output
200
10
200
95%
Visible Light: The visible light was around 400 lumens prior to the start of the eclipse. At the time of the Totality, it dropped 35% to 260 lumens.
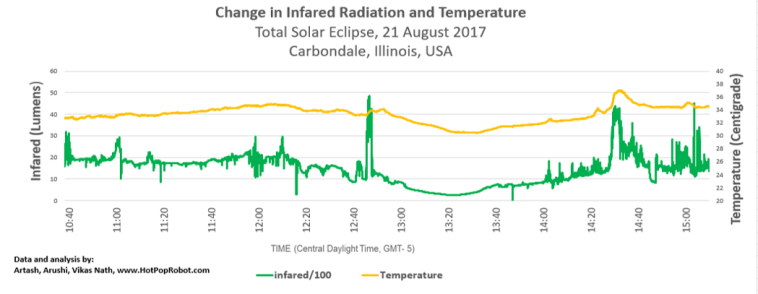
Infrared Light: The infrared light was around 2000 lumens. It dipped a drastic 87.5% during the Totality to 250 lumens. The maximum dip occurred at 13:20, the same time as the maximum temperature dip.
Temperature: The temperature prior to the Eclipse (first contact) was 34-degree centigrades. The temperature readings were slowly rising before the eclipse but at 12:50 (CST), 1h 20 min into the eclipse, we noticed that the temperature started dipping. The maximum dip in temperature happened at 13:20 (CST) at the same time as the Totality when the temperature dipped 13% to 30.5-degree centigrades.
Solar Output: This parameter showed the most variation. There was a 95% reduction in solar power received per unit area during the Totality. The dip started at 12:30, dipping gradually at first and then at 13:00, it started dipping drastically. The maximum dip was at 13:20 when the solar output almost 0.
NASA Globe Observer
Data Submitted to NASA Globe App using Solar-X
During the Total Solar Eclipse, we also collected data for the NASA Globe Observer. In particular, we collected observations pertaining to cloud cover and temperature every 20 minutes and 10 minutes respectively and submitted them.
2025 Third Grand Award, International Science and Engineering Fair, USA. 2023 Second Prize Winner – European Union Contest for Young Scientists (EUCYS). Best of the Fair Award, Gold Medal, Top of the Category, Youth Can Innovate, and Excellence in Astronomy Awards at Canada Wide Science Fair 2023 and 2022. RISE 100 Global Winner, Silver Medal, International Science and Engineering Fair 2022, Gold Medal, Canada Wide Science Fair 2021, NASA SpaceApps Global 2020, Gold Medalist – IRIC North American Science Fair 2020, BMT Global Home STEM Challenge 2020. Micro:bit Challenge North America Runners Up 2020. NASA SpaceApps Toronto 2019, 2018, 2017, 2014. Imagining the Skies Award 2019. Jesse Ketchum Astronomy Award 2018. Hon. Mention at 2019 NASA Planetary Defense Conference. Emerald Code Grand Prize 2018. Canadian Space Apps 2017.