Arushi Nath. On April 1, NASA launched four astronauts toward the Moon aboard Artemis II, including Canadian astronaut Jeremy Hansen, the first Canadian to leave low Earth orbit. I have […]
Arushi Nath.
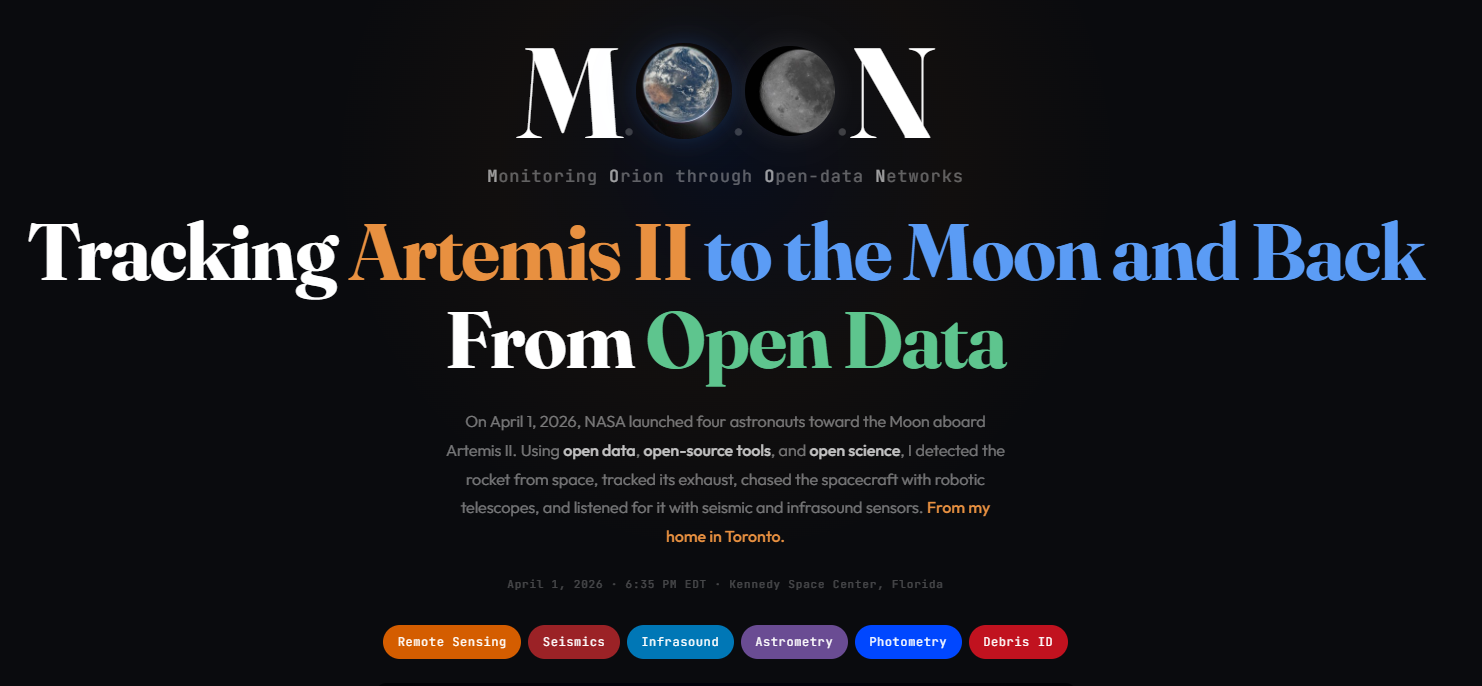
On April 1, NASA launched four astronauts toward the Moon aboard Artemis II, including Canadian astronaut Jeremy Hansen, the first Canadian to leave low Earth orbit. I have been using open science and open data to track the spacecraft every night since, its launch at the Kennedy Space Centre from my home in Toronto using satellite imagery, robotic telescopes, and data from seismic and infrasound arrays.
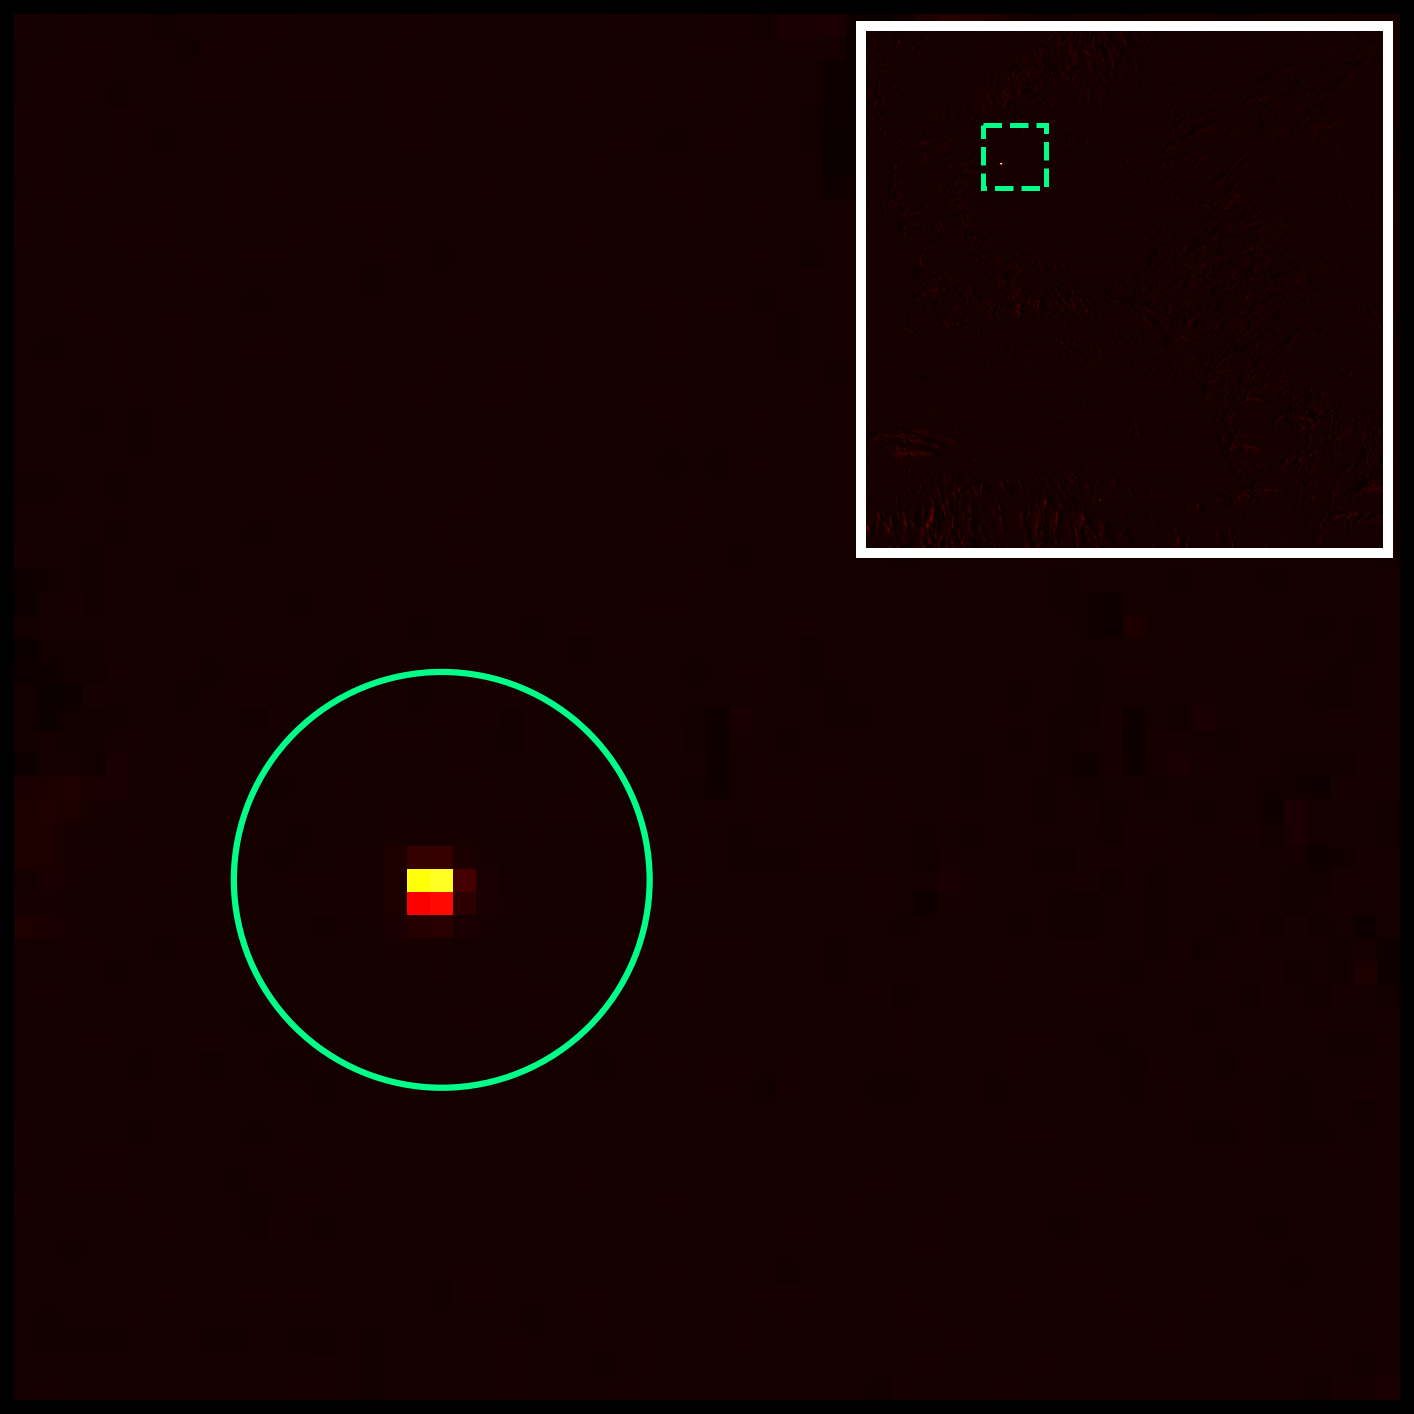
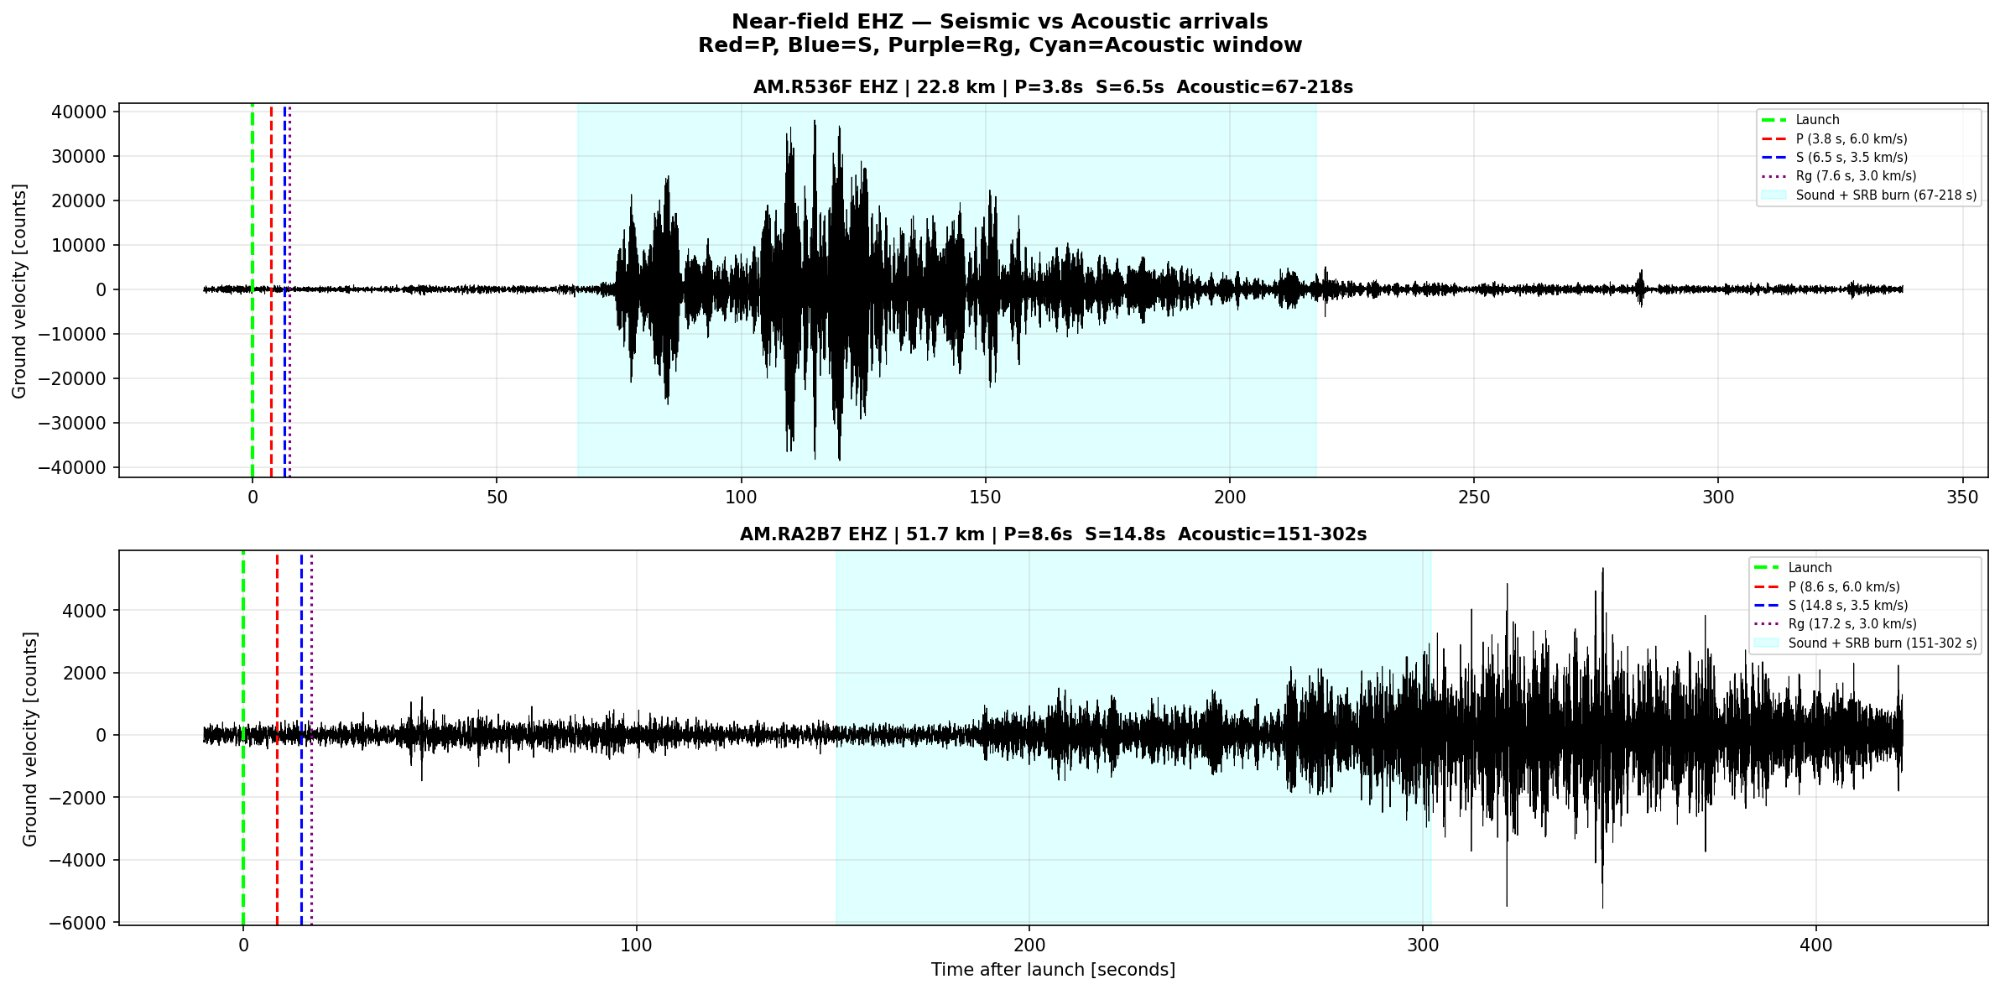
Before the rocket even cleared the tower, I was watching from space. I processed raw GOES-19 infrared satellite data and found a heat spike at Launch Complex 39B – the rocket’s exhaust detected from 35,786 km. I built a 7-frame animation from raw NetCDF files showing the exhaust trail drifting northeast. I also analysed seismometer data from Raspberry Shake stations 23 and 52 km from Kennedy Space Centre, and infrasound signals detected on the International Monitoring System (IMS) array in Bermuda, 1,580 km away.
GOES-19 / ABI · Band 7, 3.9 μm SWIR · Temporal difference vs 1 min before launch · 22:35 UTC · Raw data: s3://noaa-goes19/ABI-L2-MCMIPM/ Raspberry Shake geophones at 23 km and 52 km from KSC. Teal line: speed of sound (~340 m/s). Red/blue markers: body-wave velocity (~6 km/s). Data: Raspberry Shake FDSN (AM network). Bandpass: 0.5–10 Hz. Processed with ObsPy. Analysed by Arushi Nath.
Finding Orion Spacecraft with telescopes
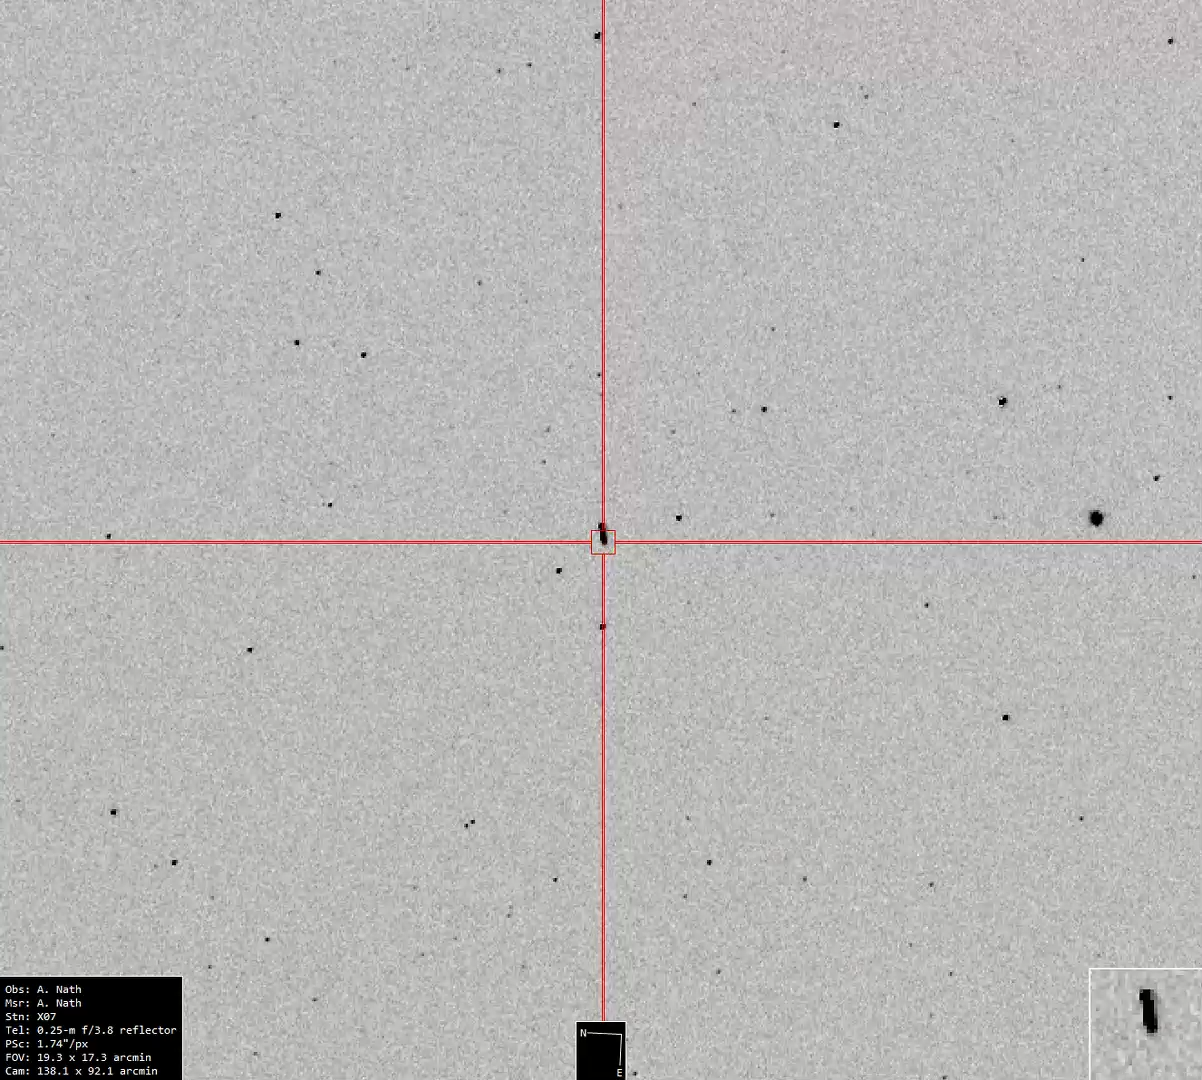
Four hours after launch, I pointed T70, a wide-field telescope in Chile, at where JPL Horizons predicted Orion would be. The spacecraft was racing at 127.9 arcsec/min with uncertain coordinates. I found it. My measured position matched Horizons to within 2 pixels. I then switched to T75, a deeper telescope with better resolution for photometry, and captured 68 frames of both Orion and the ICPS upper stage.
Tracking mode — telescope follows Orion, stars trail in the background
Over the following five nights, I tracked Orion from Chile, Spain, and Australia, 313 frames across 7 sessions, watching it get fainter as it flew to the Moon. Exposures went from 1 second on launch night to 60 seconds by the flyby. The last image, taken two hours after the crew flew around the far side of the Moon, was washed out by moonlight – Orion at its farthest, and the Moon at its closest.
What I measured
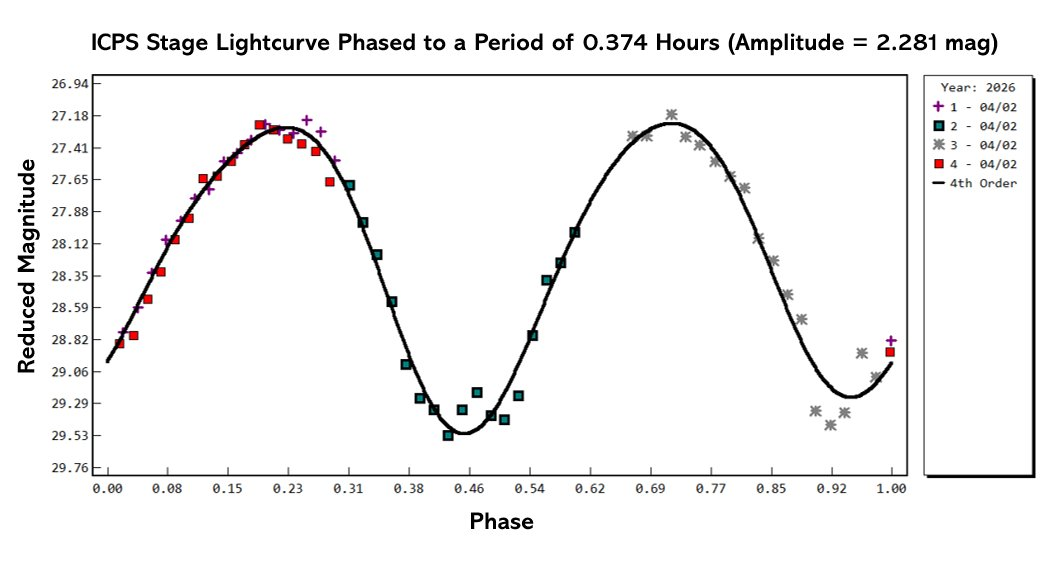
From the T75 light curves, I determined the ICPS upper stage rotation period at 0.376 hours (22.6 minutes). The phased light curve shows a clean double-peaked profile consistent with a tumbling cylinder catching sunlight from two faces per rotation.
In the same 1° field of view, I spotted a streaking object. I measured 11 CCD positions, submitted an ADES astrometric report to Project Pluto, and it was matched to NORAD 20356 a discarded rocket body from 1989, orbiting at 22,605 km. My measured motion matched the computed trajectory almost exactly.
Phased to 0.376 h. Double-peaked = tumbling cylinder
The personal connection
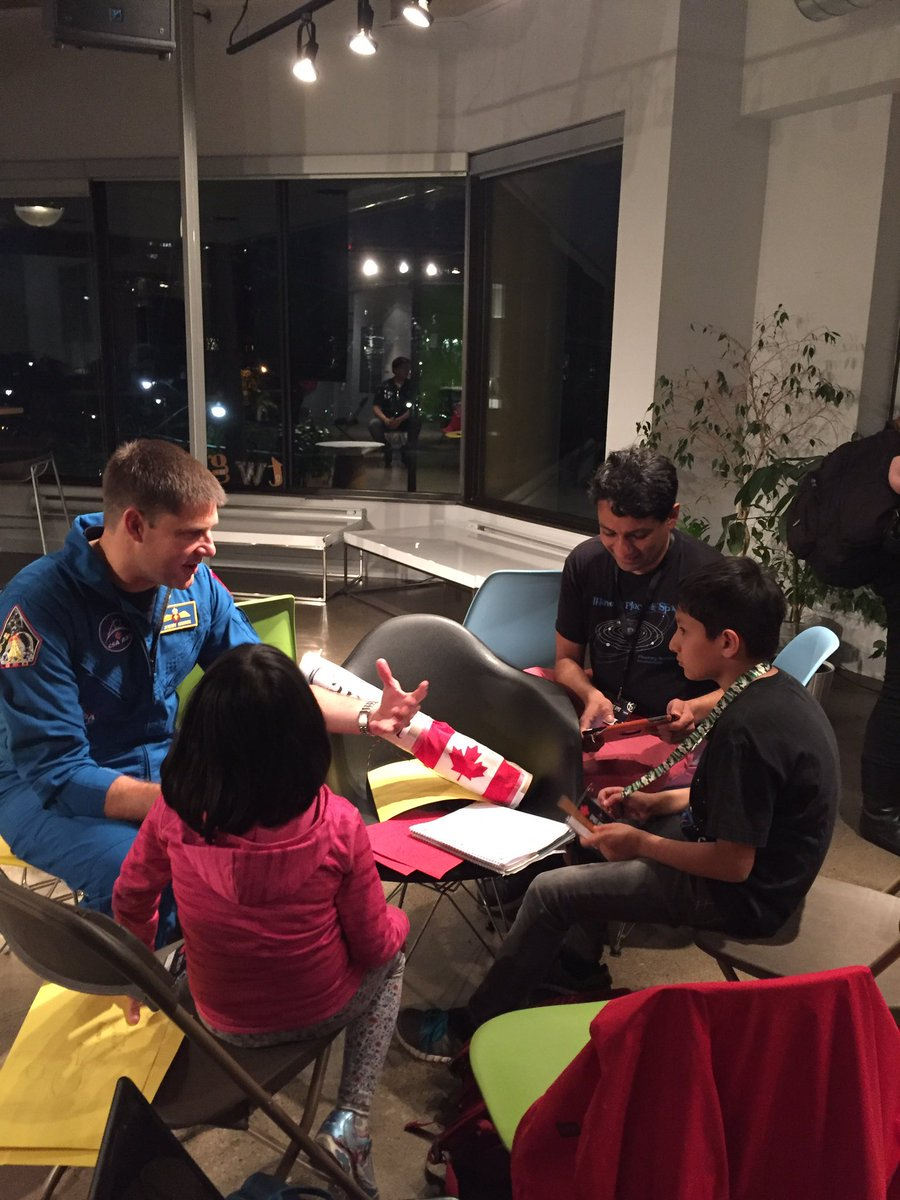
In 2017, I won the Canadian Space Agency’s Space Apps Challenge and was invited to CSA headquarters to deliver my presentation. I was 7 years old. There I met Jeremy Hansen and Jenni Gibbons. Nine years later, I am tracking Hansen’s spacecraft around the Moon. More details at https://hotpoprobot.com/2017/08/02/visit-to-the-canadian-space-agency-2/
What’s next
I’m still tracking Orion each night as the crew returns to Earth. Splashdown is Friday, April 10. I plan to listen for re-entry infrasound and splashdown seismoacoustics. An arXiv preprint is in preparation.
2025 Third Grand Award, International Science and Engineering Fair, USA. 2023 Second Prize Winner – European Union Contest for Young Scientists (EUCYS). Best of the Fair Award, Gold Medal, Top of the Category, Youth Can Innovate, and Excellence in Astronomy Awards at Canada Wide Science Fair 2023 and 2022. RISE 100 Global Winner, Silver Medal, International Science and Engineering Fair 2022, Gold Medal, Canada Wide Science Fair 2021, NASA SpaceApps Global 2020, Gold Medalist – IRIC North American Science Fair 2020, BMT Global Home STEM Challenge 2020. Micro:bit Challenge North America Runners Up 2020. NASA SpaceApps Toronto 2019, 2018, 2017, 2014. Imagining the Skies Award 2019. Jesse Ketchum Astronomy Award 2018. Hon. Mention at 2019 NASA Planetary Defense Conference. Emerald Code Grand Prize 2018. Canadian Space Apps 2017.