Arushi Nath On 11 December 2021, MIT organized the Youth Solveathon Workshop to give an opportunity to girls under the age of 18 to come together and discuss real-world problems as […]
Arushi Nath
On 11 December 2021, MIT organized the Youth Solveathon Workshop to give an opportunity to girls under the age of 18 to come together and discuss real-world problems as well as come up with innovative solutions. The main problem discussed was how to reverse climate issues such as deforestation, air and water pollution, and biodiversity loss.
During the workshop, I had the chance to brainstorm solutions with youth from all around the world. They came from the United States, India, Canada, and China. Listening to environmental initiatives taken by them and their ideas on how to take them forward was very inspiring. Some youths talked about forestry and biodiversity initiatives while others talked about cleaner oceans. Based on these topics, we formed 5 teams. As a group, we carried out research on different climate change-related topics and gave a presentation to the other groups on our proposed solutions. My team chose deforestation. One of the ideas we came up with was creating an App that rewards you every time you plant a tree or plant.
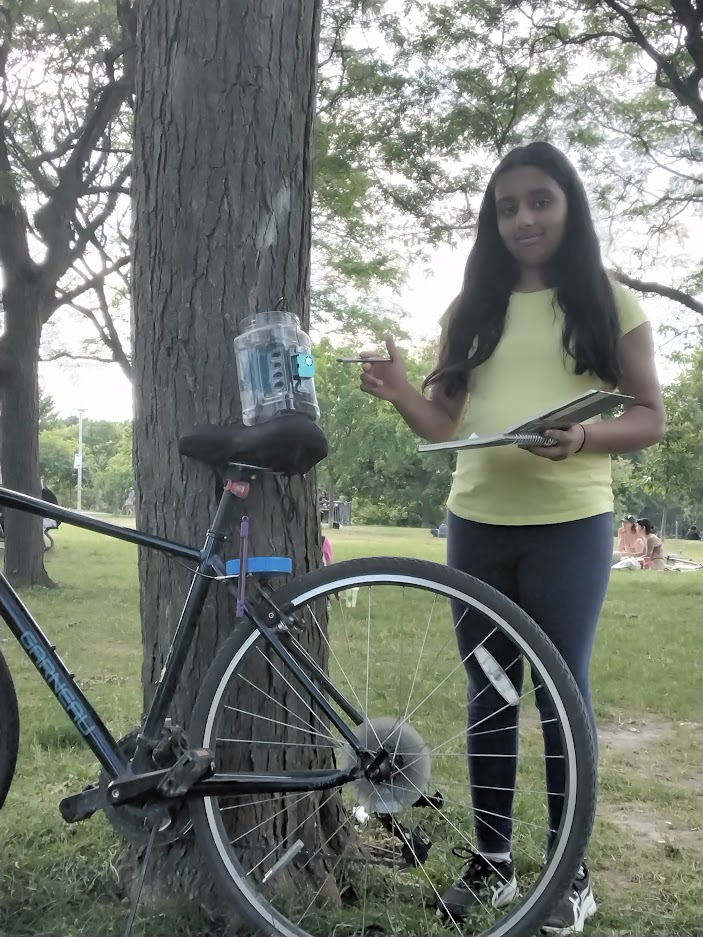
Measuring Pollution readings at Christie Pits Park
Following the workshop, there was an opportunity to apply for micro-grants to transform ideas into prototypes. Interested participants had to apply online and share details, including their ideas, how they would implement, what materials (hardware and software) would be required, how much the costs would be, and the timeline over which they would implement their solution. This was a great opportunity, and I submitted my application to transform my idea about “Monitoring Tree Density of Local Parks” to increase urban forestry and biodiversity in Toronto.
The idea was well received, and in January 2022, I received a notification that my project was selected for a $600 Prototyping Micro-grant. My solution aimed to raise awareness about the benefits of parks among youth and encourage them to take action to help improve their local parks. To do so, I wanted to calculate how green parks were using their tree density. I could rank different parks based on their tree density. To validate these findings, I would calculate the Normalized Difference Vegetation Index of the parks. I also wanted to compare pollution levels in different parks. This separated my project into 3 parts.
First: calculating tree density. To do so, I turned to satellite images of parks. I was able to access high-resolution imagery from the Planet Labs Dove satellites. With those images, I used i-tree canopy tool developed by the USDA Forest Service to help me find the tree density of 3 local parks: Trinity Bellwoods Park, Stanely Park, and High Park.
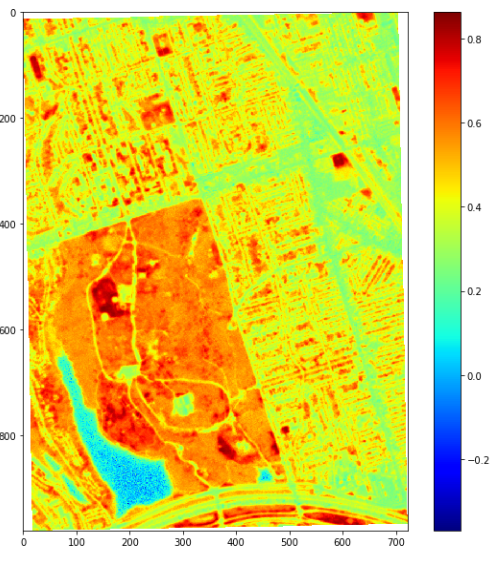
Second: validating results. To validate tree density results, I used satellite imagery to calculate the Normalized Difference Vegetation Index (NDVI) of each park. NDVI is an indicator used to quantify vegetation greenness. It is useful in understanding vegetation density and assessing changes in plant health. It does this by looking at the reflectivity of the image in different frequencies. I used the python library Rasterio to extract the four bands (Red, Green, Blue, and Infrared) from the image file and then used the NDVI formula to calculate the average NDVI of my park image.
NDVI index calculated for High Park using Satellite Imagery from Planet Labs. Red area means the highest vegetation index, and blue means a lower vegetation index.
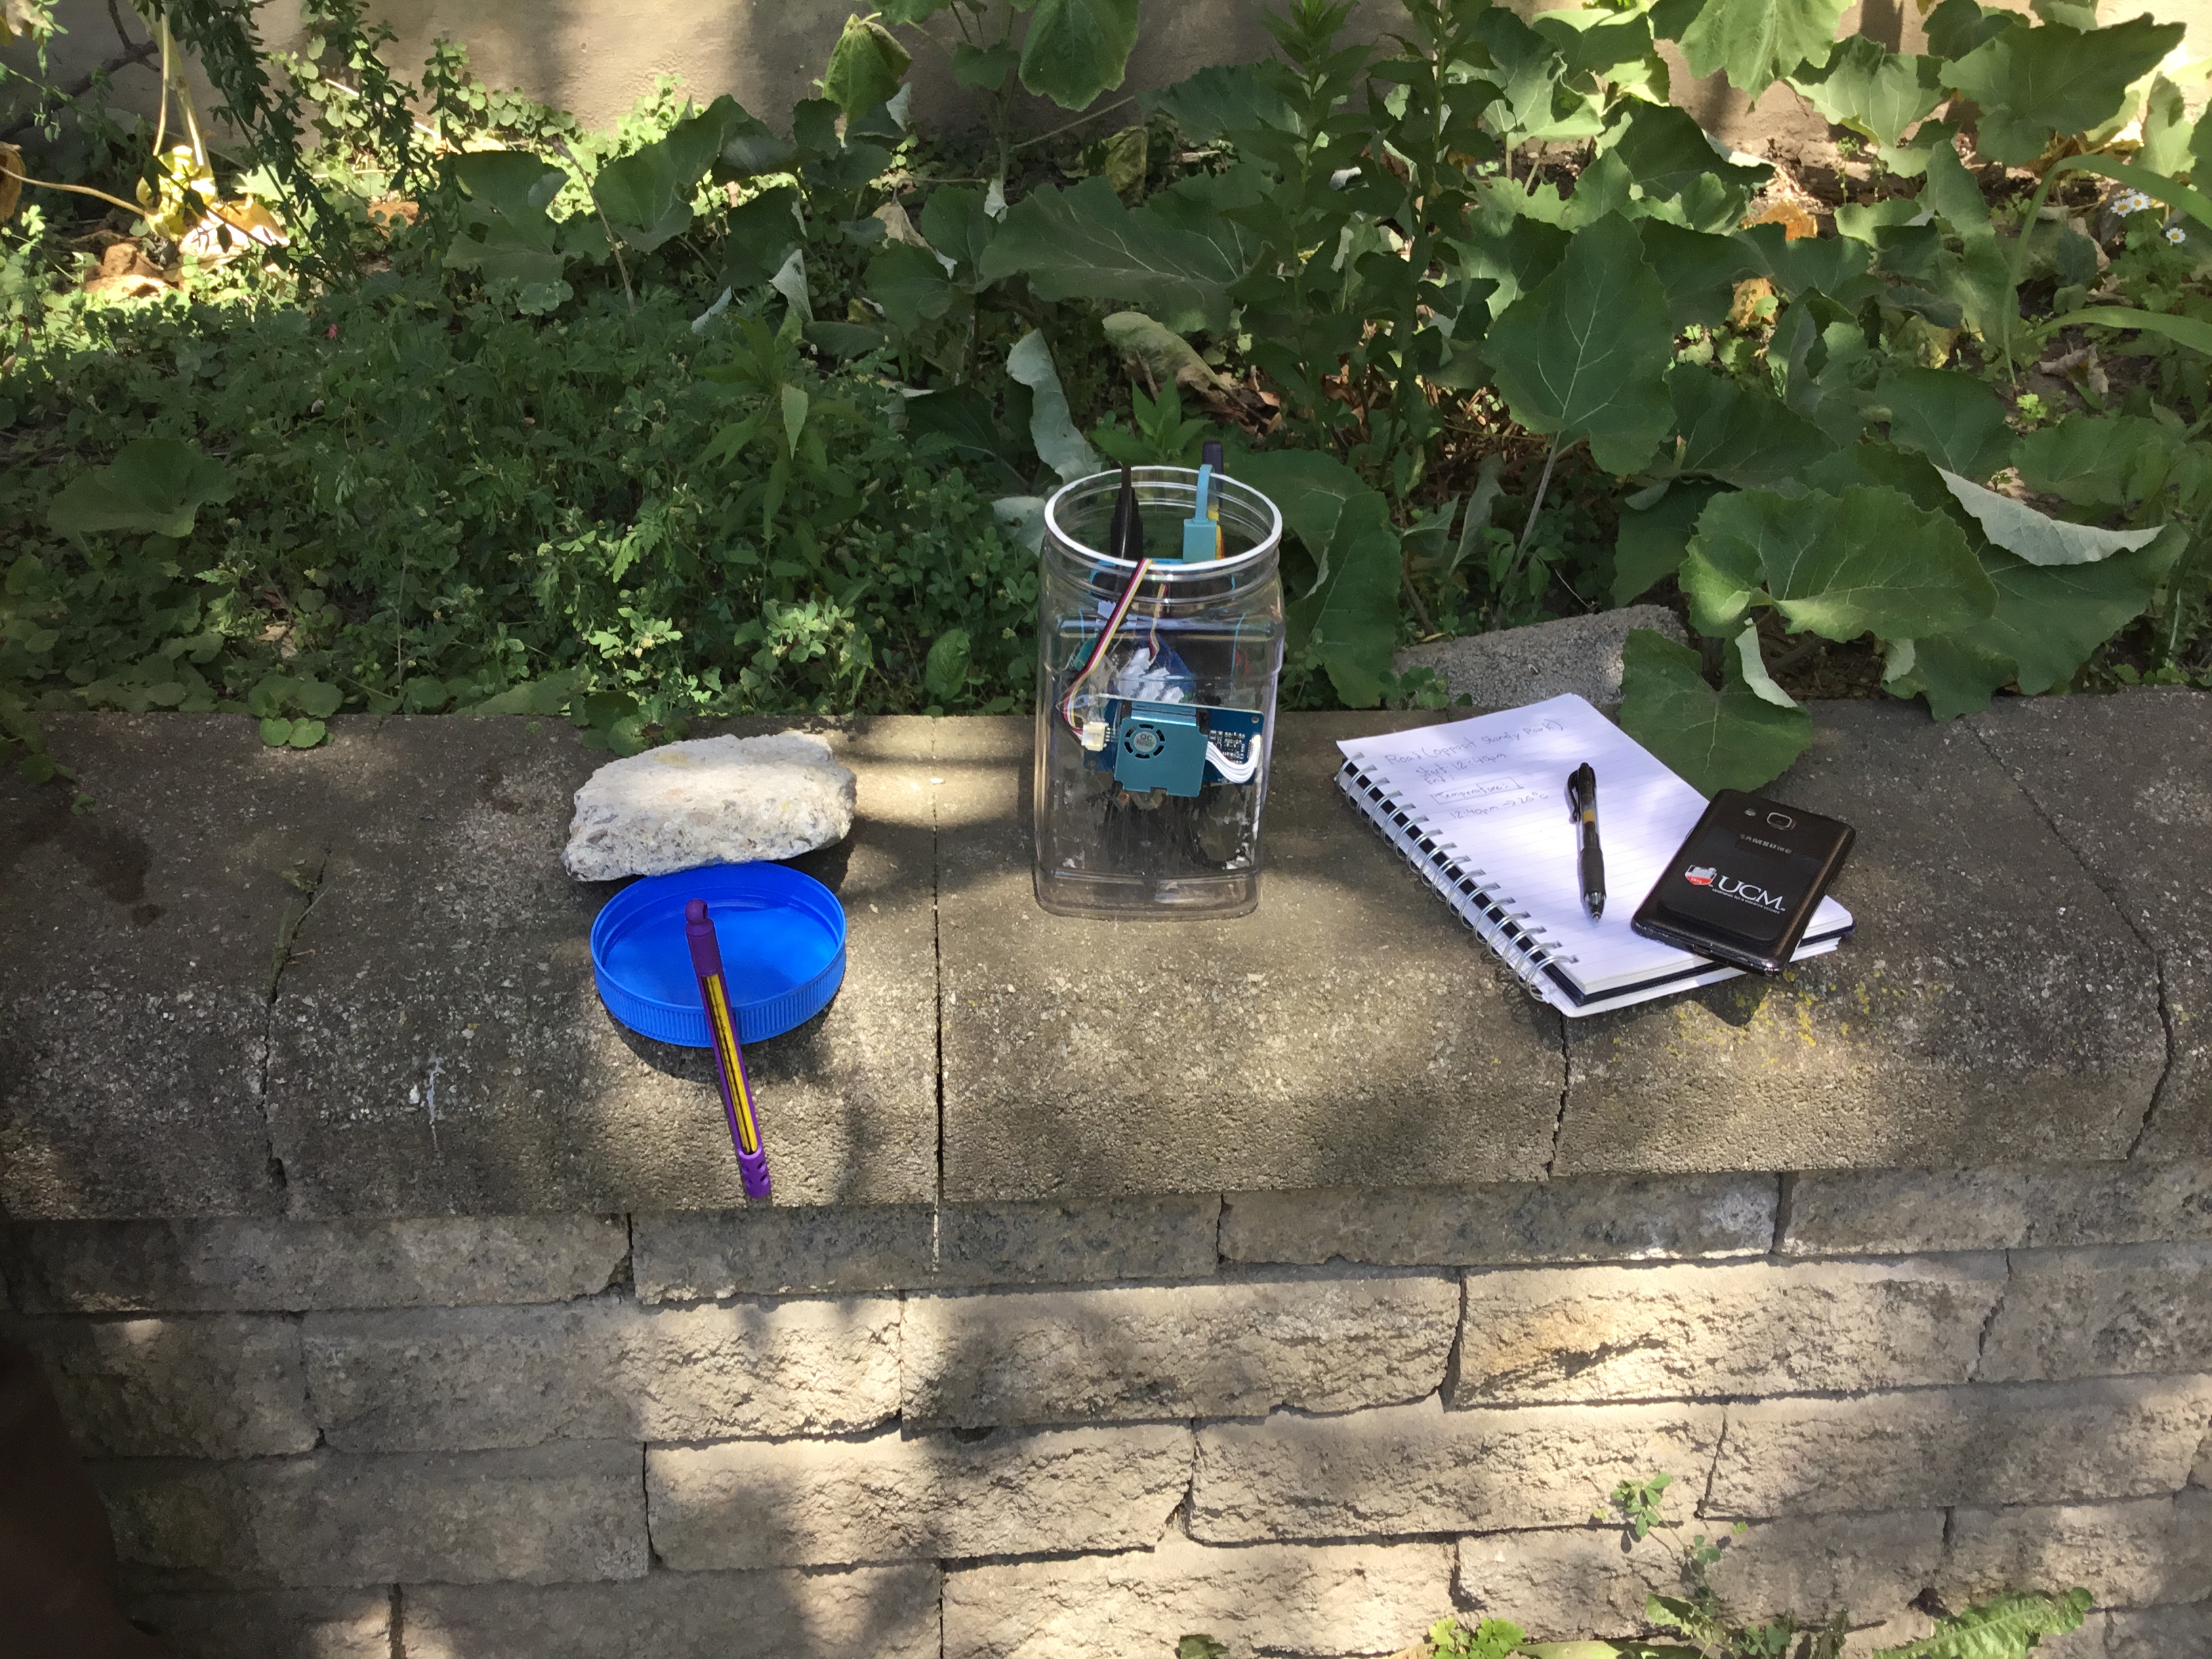
Third: measuring pollution levels in parks. I created a homemade instrument with a pollution sensor to extract the pollution levels of neighbourhood parks. It contained the PM 2.5 pollution sensor, an Arduino microprocessor, a SEEEDUINO shield to connect the sensor with the Arduino, and a Wi-Fi shield to transmit sensor data collected from the Arduino online to a website.
I created an account with ThingSpeak – an IoT analytics platform service that allowed me to receive data from the Wi-Fi shield, and plot the data at a 20 seconds interval. The entire wireless arrangement allowed me to take my homemade device to different Toronto parks and measure pollution levels by simply creating a mobile hotspot using my mobile phone.
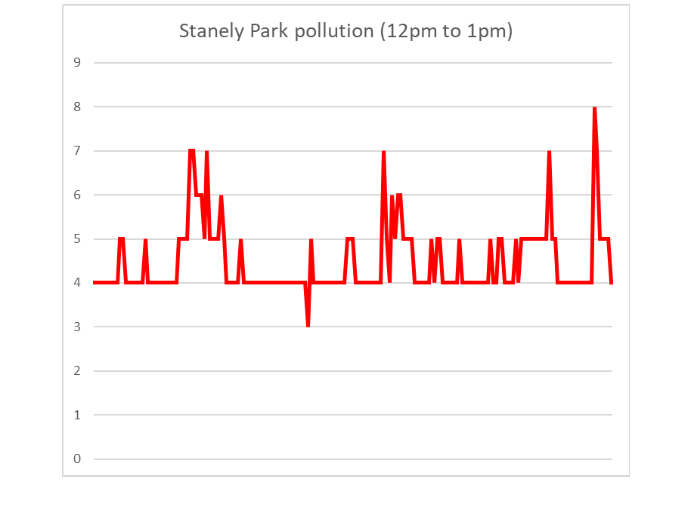
Pollution readings coming from my pollution sensor at Stanely Park
The MIT Solv[ED] Prototyping Micro-grant allowed me to test out my ideas. and evaluate its strengths and weak points to improve it further. I am now more determined and confident about taking the project further. I plan to adopt a two-step approach to expand my project to more parks in Toronto and beyond.
My Homemade Instrument to measure pollution and transfer data wirelessly that I plan to replicate to crowdsource data from other youths.
First, I will create more versions of my homemade instrument and give them to other youths so they can find the pollution level of their local parks. Second, I will create a web app to store all information I and other youths have collected. The webapp will be coded in python and include an interactive map of Toronto. This crowdsourcing model of collecting data could then be expanded beyond Toronto.
2026 Third Place, Student Oral Competition, NASA Exploration Science Forum, USA. 2025 Third Grand Award, International Science and Engineering Fair, USA. NASA Group Achievement Award 2025 (DART mission team). 2024 Youth Can Innovate Award ($7,000) and Silver Medal, Canada-Wide Science Fair. Gloria Barron Prize for Young Heroes 2024. Eureka Changemakers Fellow 2025. 2023 Second Prize Winner – European Union Contest for Young Scientists (EUCYS). Best of the Fair Award, Gold Medal, Top of the Category, Youth Can Innovate, and Excellence in Astronomy Awards at Canada Wide Science Fair 2023 and 2022. RISE 100 Global Winner, Silver Medal, International Science and Engineering Fair 2022, Gold Medal, Canada Wide Science Fair 2021, NASA SpaceApps Global 2020, Gold Medalist – IRIC North American Science Fair 2020, BMT Global Home STEM Challenge 2020. Micro:bit Challenge North America Runners Up 2020. NASA SpaceApps Toronto 2019, 2018, 2017, 2014. Imagining the Skies Award 2019. Jesse Ketchum Astronomy Award 2018. Hon. Mention at 2019 NASA Planetary Defense Conference. Emerald Code Grand Prize 2018. Canadian Space Apps 2017.
Follow Us on Twitter
Do it Yourself Asteroid Astrometry using Python for Asteroid Apophis
The Masked Scales; 2020 NASA SpaceApps COVID-19 Challenge Global Winners!
Deep Space Musical: NASA SpaceApps 2018 Toronto Winner
LIGO Quadruple Pendulum: Swinging to Stability, Royal Astronomical Society of Canada 2019
TVO Kids (2018): TRAPPIST-1 Sound and Light Model
Lecture on TRAPPIST-1 at Carr Astronomical Observatory (CAO) Open House
Yes I Can / Oui Je Peux: NASA – Canadian SpaceApps Toronto 2017 Winner
Drop the Drought : NASA Space Apps Toronto 2017 Winner