Artash Nath. Grade 8 Student. Toronto.
On 11 March 2020, the World Health Organization (WHO) declared Coronavirus disease (COVID-19) as a pandemic. By then it had spread to at least 110 countries. The  announcement made by WHO had a cascading effect. Cities, territories, and countries around the world ended up declaring states of emergency. Strict physical distancing and public health measures were implemented to curb the spread of the disease. Schools, universities, malls, non-essential government, and private offices were closed putting cities under siege. The roads, public spaces, ports, railway stations, and airports started to become deserted as human movements reduced.
(To stay updated on this study, follow me on twitter: https://twitter.com/wonrobot )
Canada was no exception. All Canadian provinces and territories — implemented some public or health emergency measures to check the spread of COVID-19 as we will see below.
Timeline of Measures taken by Canada in March 2020 leading to COVID-19 Lockdown
To understand the impact of the reduction in human activities on seismic vibrations, it was important to find out dates when different provinces and cities in Canada initiated the lockdown measures. The measure of seismic vibrations a few weeks prior to the start of the lockdown would provide the baseline to assess the changes happening during the lockdown and after the lockdown.
March 11: WHO declares COVID19 as a pandemic
March 13: Quebec declares public health emergency
March 14: Edmonton city closes public facilities
March 16: Prince Edward Island Declares state of emergency
March 17: Ontario declares a state of emergency
March 17: Alberta declare states of emergency
March 17: Yukon declares state of emergency
March 18: Canada-US border closed
March 18: British Columbia provincial state of emergency declared
March 18: Saskatchewan declares state of emergency
March 18: Newfoundland and Labrador declare a state of emergency
March 18: North West Territories declare a state of emergency
March 18: Nunavut declares public health emergency
March 19: New Brunswick declares state of emergency
March 20: Manitoba declares state of emergency
March 22. Nova Scotia declared a state of emergency
March 24: Quebec closes non-essential businesses
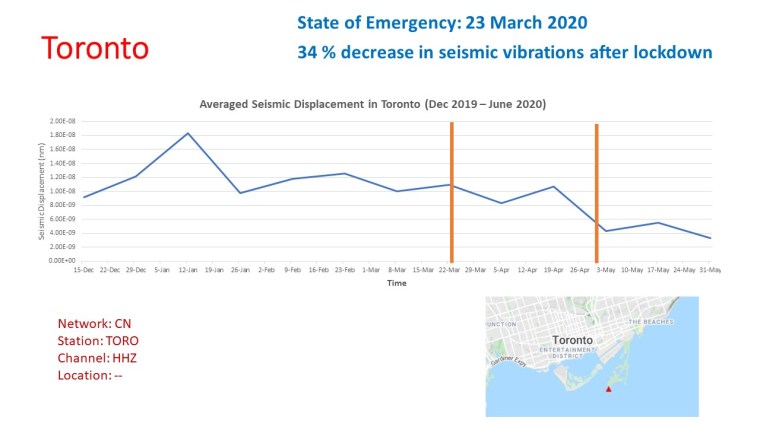
March 23: Toronto declares a state of emergency
March 26, British Columbia goes into lockdown
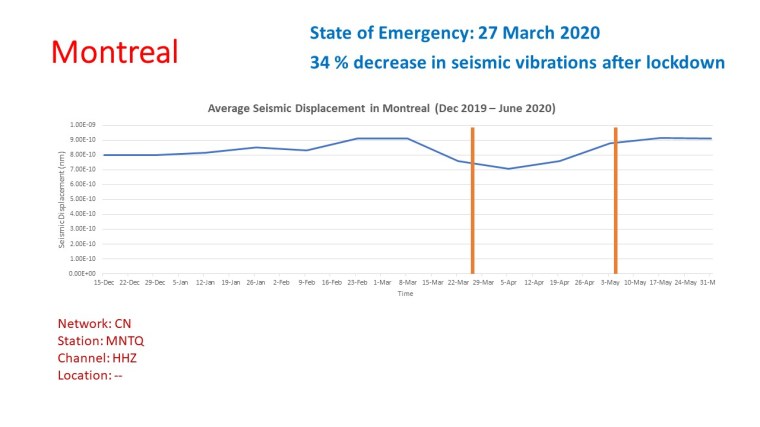
March 27:Montreal declares local state of emergency amid COVID-19 pandemic
March 31: Majority of Air Canada flights shut down
Impact of COVID-19 Lockdown on Human Activities
COVID-19 pandemic changed the lives of people. A lockdown was essential to check the spread of the pandemic and the overflowing of hospitals, and to not overwhelm the health care workers and supplies.
The lockdown of cities resulted in an immediate reduction in traffic, human movements, shipping, railways, air travel, construction, mining, and other economic activities. It turned out to be one of the biggest experiments in the modern world to fight a common enemy. Every individual, household, and business had to participate in it by curbing their movements. The lockdown provided an opportunity to measure the impacts of the sudden stoppage of human activities on the seismic vibrations.
Project Goal: Measuring the Impact of COVID19 Lockdown on Seismic Vibrations and Ocean Acoustics in Canada
COVID-19 may have closed school doors but not the windows to education. During this time, I was undertaking a couple of experiments and studies to study changes in my local environment such as sound, traffic, and pollution levels brought about by the lockdown. But I wanted to do more and understand the impact at the national level.
The goal of my project was to understand the changes in seismic vibrations registered by the land-based seismic stations and oceanic hydrophones before, during, and after the lockdown.
I used the lockdown dates I researched in the news (and made available in a section above) to guide my analysis. It is to be noted that the severeness of the lockdown and how it was enforced varied from city to city. Furthermore, while the start of the lockdown was more rigid, the end of the lockdown was more fluid. Some cities decided to extend the emergency with the same restrictions while others extended the lockdown with a loosening of restrictions.
Seismic Stations and Data Structures
Seismic stations record different kinds of ground movements data, depending on their instruments, sensitivities, and sampling rates.
Three things that are common to all seismic stations are a seismometer for sensing ground motions, a recorder to collect data, and a clock for time-stamping the data. Together they allow us to create time-series graphs of the ground motion which are essential to determining the magnitude of the earthquake, how long they lasted, and the location of origin of the earthquakes.
Some of the seismic stations only measure ground movements in a single direction, say vertical movements (along the z-axis). Others are able to measure ground movements in all three dimensions and provide more complete data.
To get data from a particular seismic station, I needed to first identify the station, and then identify the instruments from which I needed to get data and for what time period.
It is important to know the codes of the following parameters when accessing data from seismic stations.
- network code
- station code
- location code
- sensor channel
With practice, it becomes easier to find the necessary codes for these parameters. One could even put “wild-card” entries that make it simpler to acquire data.
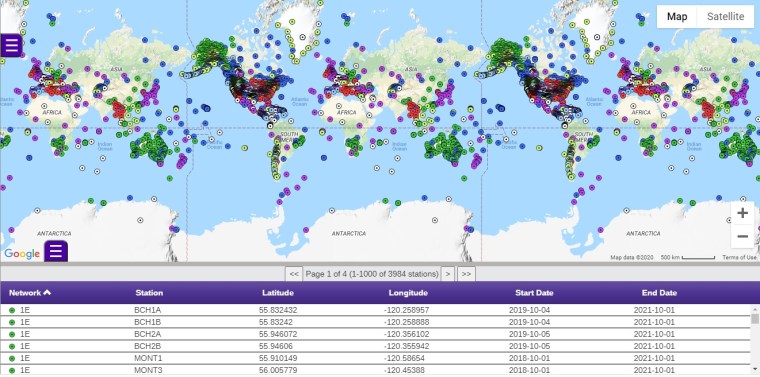
The world map of all seismic stations worldwide collecting real-time data is given at http://www.iris.washington.edu/gmap/#network=_REALTIME&planet=earth
Seismic stations often collect a vast amount depend upon their sampling rates. Some of them collect 100 readings a second. This means very high data processing capacities are needed to handle the high volume of data. It becomes essential to limit the time period for which we want the analysis to be carried out.
It is important to note the COVID-19 did not affect the natural sources of seismic vibrations such as wind, waves, tides, or earthquakes. The seismic stations continued to actively register those ground vibrations. The signature of human activities on seismic vibrations is markedly different from natural sources of seismic vibrations. Seismic noise with frequencies above 1 Hz is generally associated with human activities.
Source of Seismic Data in Canada
The Geological Survey of Canada (GSC) is responsible for maintaining a Canada-wide network of seismic stations to record ground motion from earthquakes and other sources. The Canadian National Seismograph Network (CNSN) constitutes 100 high-gain instruments, called seismographs, and over 60 low-gain or strong-motion seismographs called accelerographs.
As with many of the seismic stations worldwide, the data is available in the public domain in near-real time. For the purpose of this study, I used the data from Canadian seismic stations that were made available on the IRIS platform. Many of these stations can measure seismic vibrations down to the frequency of 0.1 Hz.
Selection of Canadian Cities
I analyzed continuous seismic data during the lockdown and after the lockdown for 6 Canadian cities: Calgary (Alberta), Edmonton (Alberta), Montreal (Quebec), Ottawa (Ontario), Toronto (Ontario) and Yellowknife (North West Territories).
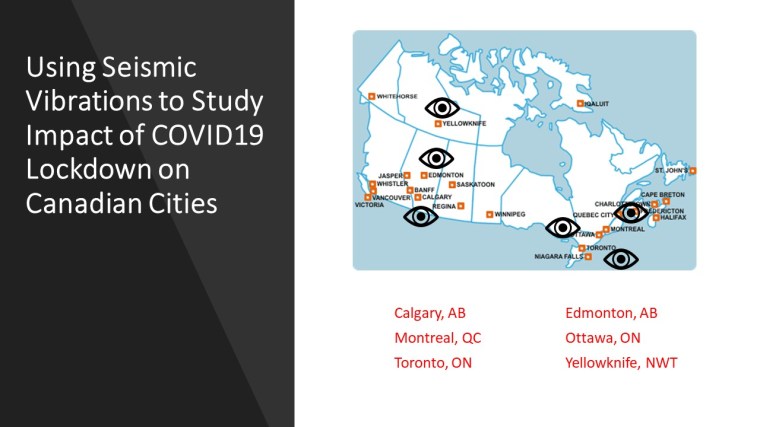
I selected these 6 cities for the following reasons:
- These cities are spread out in 4 provinces and provide a good representation of Canada.
- The cities that had a seismic station nearby – as I wanted to assess the impact of lockdown in cities and a reduction in human activities.
- The seismic stations near these cities were active and collecting data for the period I was interested in.
- The data from the seismic stations was public and available in near real-time.
Methodology
The data from these stations were provided in MSEED files. These files contain the raw seismic waveform data from the stations. I downloaded the MSEED files from the seismic stations closest to 6 cities selected for the study.
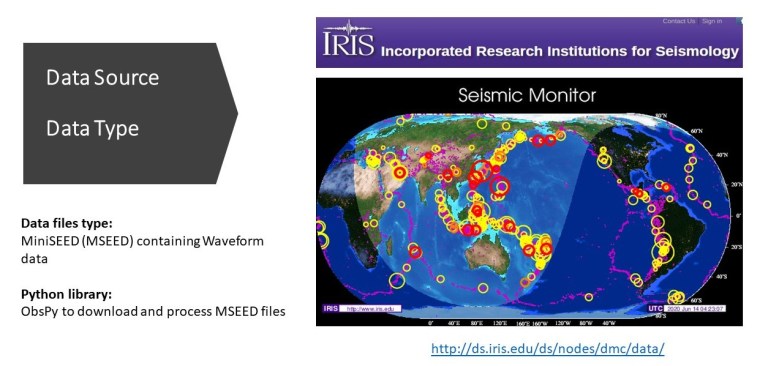
I decided to analyze and clean this data using Python and ObsPy. ObsPy is a python library that helps to load and process seismic data. After loading the data from the MSEED files into python, I undertook the following 4 steps:
- I started by converting the raw data into Probabilistic Power Spectral Densities (PPSDs) to make it easier to perform analysis on the data. The PPSDs break down the raw data into a histogram, showing the amounts of seismic vibration for a range of frequencies.
- Seismic Vibrations come in several frequencies. Earthquakes, for example, usually vibrate the ground at a frequency of 1 – 100 HZ. Waves from oceans and lakes vibrate the ground at < 1 HZ. But I only wanted to measure the change in seismic vibrations caused by human activity, such as the movement of cars on the road, trains, or construction. These cause seismic vibrations in the frequency range of 0.1 Hz to 20 Hz. So, I extracted all the seismic vibrations in the PPSDs that fell between 0.1 HZ and 20 HZ.
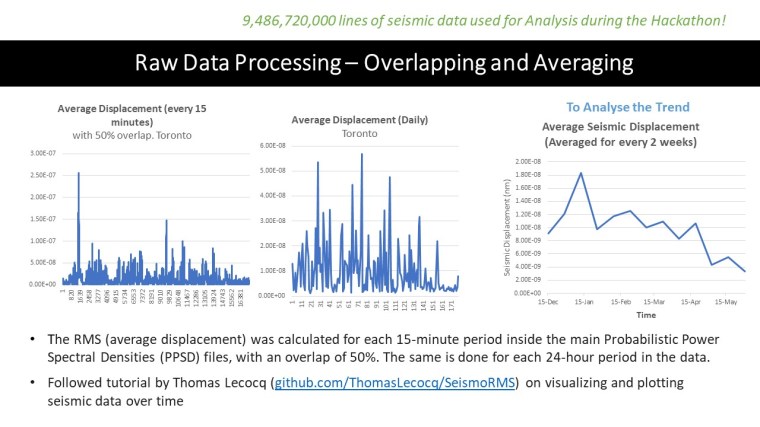
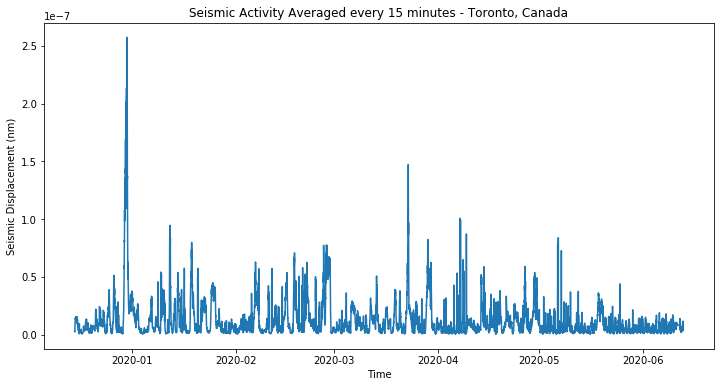
- Seismic monitoring stations have a very high sampling rate. In fact, they record data at a sample rate of over 100 values per second! As I downloaded around 6 months of data for each station, I had over 1.5 billion data points for each city. The first step in reducing this data was calculating the Root Mean Square for each 15 minute period inside the 6 month period, with a 50% overlap to reduce large spikes. This compressed the data down to 35 000 data points.
- To reduce the data even further, and create a trend of the seismic vibrations, I averaged the seismic vibrations for every 2 week period. This resulted in a much smaller and cleaner plot. I then averaged the seismic vibration levels before the lockdown, and during the lockdown, and compared them to calculate the percentage change.
I performed the above steps for data from all the 6 cities.
Results: Impact of COVID-19 Lockdown on Seismic Vibrations in Canada
I analyzed continuous seismic data during the lockdown and after the lockdown for 6 Canadian cities: Calgary (Alberta), Edmonton (Alberta), Montreal (Quebec), Ottawa (Ontario), Toronto (Ontario) and Yellowknife (North West Territories). The results of the analysis are graphed below.
Conclusions
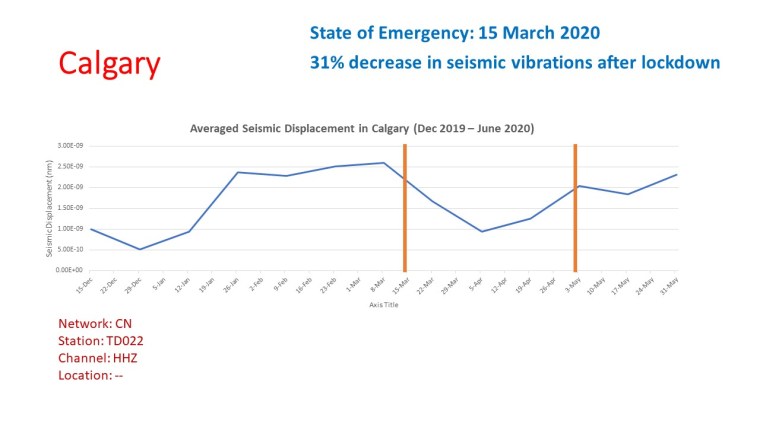
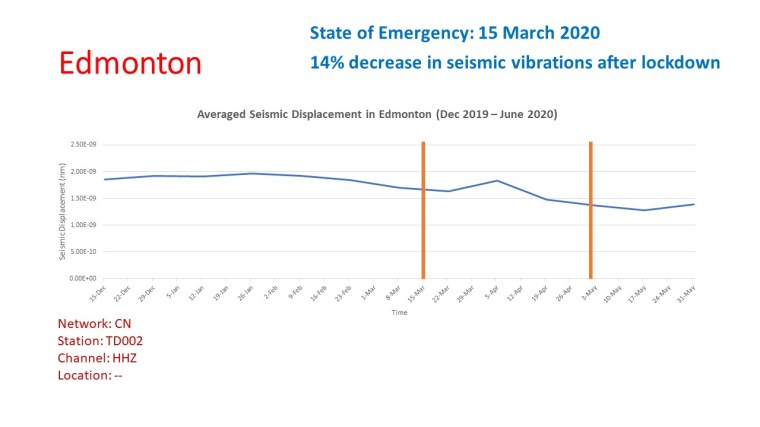
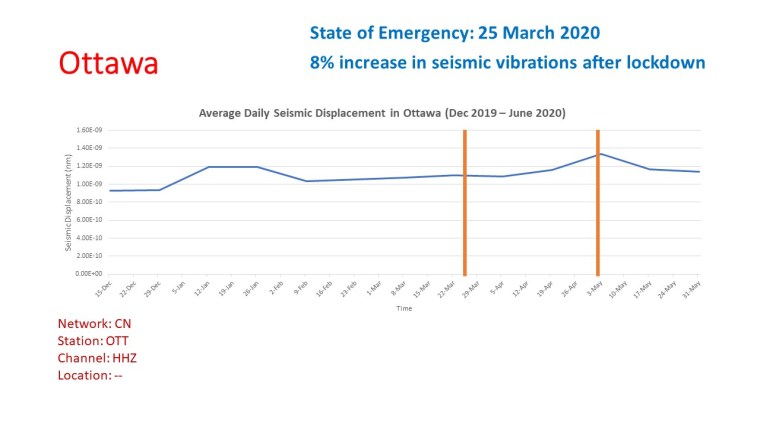
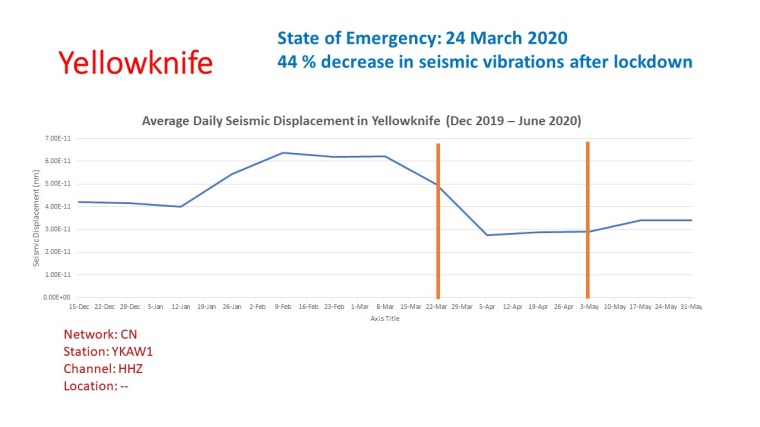
From the analysis, it was evident that lockdown had an impact on seismic vibrations in almost all the cities I analyzed. In all the cities I analyzed, except Ottawa, the seismic vibrations decreased between 14% – 44% with the biggest decrease in Yellowknife in the North-Western Territories. In the 3 densely packed cities of the population over 1 million -Toronto, Montreal, and Calgary, the seismic vibrations dropped by over 30%. In the case of Ottawa (the capital of Canada), the seismic vibrations actually increased by 8%.
Limitations
As not all the seismic stations were equally close to the cities, they were not equally sensitive to changes in human activities. Furthermore, while lockdown happened in all the cities studied for this project, the strictness enforced and the participation of people in the lockdown varied. Many cities extended the lockdown without any change while others extended the lockdown with a loosening of restrictions. All these differences induced variations in the study.
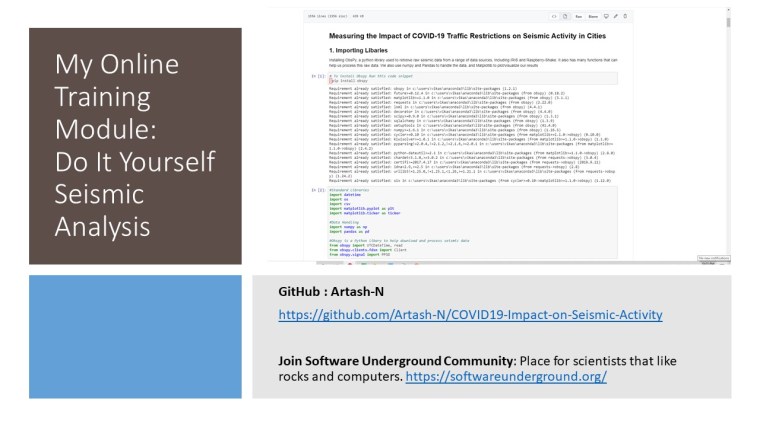
Training Module: Do your own Analysis of Seismic Vibrations
I wanted other researchers to be able to recreate my results of seismic analysis and be able to do analyses new seismic data on their own. I have written an Online Tutorial using Jupyter Notebooks detailing the process of acquiring data, cleaning it, and how to analyze it to find out the trends in seismic vibrations during the COVID-19 lockdown period.
Anyone can use my tutorial to measure the impact of COVID19 lockdown in their own cities using publicly available data in the form of MSEED files with Incorporated Research Institutions for Seismology (IRIS).
The tutorial is available on my GitHub: https://github.com/Artash-N/COVID19-Impact-on-Seismic-Activity
Impact of COVID-19 Lockdown on Ocean Acoustics
This is a work-in-progress document. I am still working on this project during my summer holidays.
The data to be analyzed is huge: billions of data points and the processing capacity of my desktop computer is very limited.
I will keep posting new analysis on seismic vibrations and ocean noises as I finish them.
Citations of Research by Other Sources
Artash Nath, a talented 8th grader from Toronto, led a project to observe the impact of COVID-19 lockdown restrictions on the traffic movement in several Canadian cities. Specifically, Artash’s goal was to measure the change in the seismic vibrations in major cities before, during, and after their lockdown period. Repo
Questions: Write to Artash at artash.nath@gmail.com or at www.twitter.com/wonrobot