Artash Nath, Grade 8 Student. Over 4,000 exoplanets have been discovered by space and ground-based telescopes. There may be billions or even trillions of these exoplanets in our galaxy alone. […]
Artash Nath, Grade 8 Student.
Over 4,000 exoplanets have been discovered by space and ground-based telescopes. There may be billions or even trillions of these exoplanets in our galaxy alone. The NASA’s ongoing Transiting Exoplanet Survey Satellite (TESS) mission is building upon the legacy of the now-retired Kepler Space Telescope and searching for possible planets around nearby bright stars. More space-based telescopes are in the pipeline to accelerate this search for the exoplanets such as the Wide-Field Infrared Survey Telescope (WFIRST), the James Webb Space Telescope (JWST) and the Atmospheric Remote-sensing Infrared Exoplanet Large-survey (ARIEL) Space Mission.
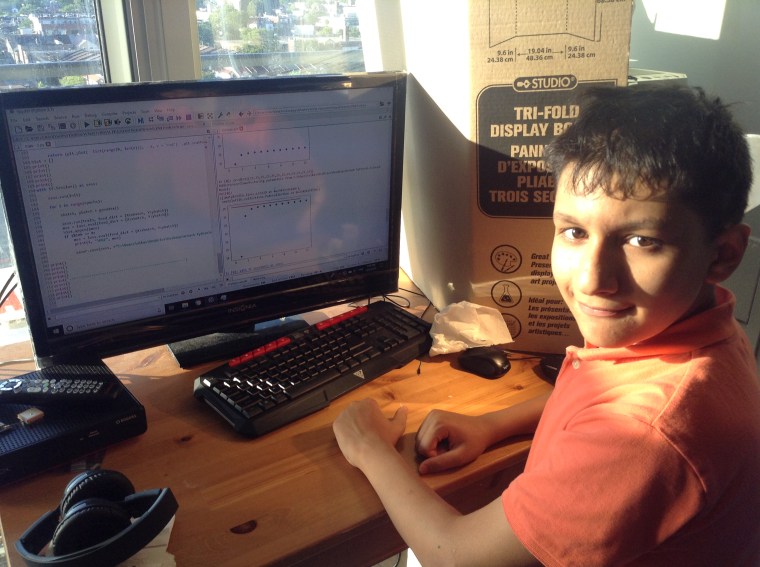
Artash working on his Machine Algorithm for the Ariel Data Challenge 2019
Big Universe, Bigger Data, Small Community
More telescopes mean more opportunities for us to learn about the universe. But telescopes also generate a massive amount of digital data. For instance, once the Square Kilometers Array (SKA) Telescope is operational it will produce exabyte-size (10 to the power of 18 bytes) datasets every day. The data from different telescopes may be in the form of numbers, images, videos, spectroscopic observations, light curves, radio observations and more. As we receive this data, we will be eager to get answers to questions in our mind. Did we find new exoplanets? What is the radius and temperature of these planets? What are their atmospheric conditions? Is there water on them? Can we identify bio-signature of life?
To go to these answers, we need to sift through the data and analyze it to extract patterns and other important features. While data about our universe is increasing exponentially, the astronomy community is not. This means we need to rely more on complex algorithms and machine learning to extract information from raw data. This may need to be done in almost real-time using massive computing power and developing custom algorithms and machine-learning models.
Building a community of people who are familiar with data being generated by the telescopes and who can come up with the most accurate prediction models is essential to accelerate discoveries. Having a wider community and opening up data analysis to crowdsourcing would mean new sets of eyes to look upon the same data and make new discoveries which may have been overlooked.
This is one reason why training the next generation of science, maths and data professionals is important in advance of operationalizing big astronomy projects.
The ARIEL Space Mission (2028)
The Atmospheric Remote-sensing Infrared Exoplanet Large-survey (ARIEL) Space Mission is a European Space Agency (ESA) mission to be launched in 2028. During its 4-year mission, ARIEL will study what exoplanets are made of, how they formed and how they evolve, by surveying a diverse sample of about 1000 extrasolar planets, simultaneously in visible and infrared wavelengths. It is the first mission dedicated to measuring the chemical composition and thermal structures of hundreds of transiting exoplanets, enabling planetary science far beyond the boundaries of the Solar System and put our Solar System in the galactic context.
ARIEL Machine Learning Data Challenge 2019
Recently (May 2019), the ExoAI project team together with the European Space Agency’s ARIEL mission conducted the first global machine learning data challenge. The objective was to find innovative solutions for the interpretation and analysis of exoplanet data.
The Ariel ML Challenge invited professional and amateur data scientists around the world to use Machine Learning to remove noise from exoplanet observations caused by starspots and by instrumentation. Automated solutions for improved analysis of light-curves through the ARIEL Machine Learning and Stellar Activity Challenge (MLSAC) will lead to better accuracy in the detection and characterisation of exoplanets – for current missions as well as future ARIEL observations.
The Ariel ML Challenge is a positive step towards creating a community of trained data analysts using simulated data before the real data starts flowing in.
114 teams registered for the Ariel ML challenge and the challenge closed on 15th August. Only 19 teams were able to complete the challenge and submit solutions. The results of the challenge are posted here.
As I love working on machine learning and applying them to different projects especially those related to space, I registered as a solo-team for this challenge and worked on this project for 3 weeks in between school and other activities.
The Goal: Finding Relative Radii
The participating teams were given a dataset of 147,000 simulated light curves, spread over 55 different wavelengths. For each of the wavelengths, the ratio of the radius of the parent star to the radius of the planet (or the relative radii) was given. The reason the radius of a planet is different over different wavelengths is because of its atmosphere, about which we will talk in the next section.
Another dataset was given: the test database. It consisted of 63,000 simulated light curves, again spread over 55 different wavelengths. The ratio of the radius of the stars to the radius of the planet was not given for this dataset.
The goal of the competition was to accurately predict the relative radii or ratio of the radius of the star to the radius of the planet for each of the light curves in the test database.
Why Radius of Planet Are Different for Different Wavelengths?
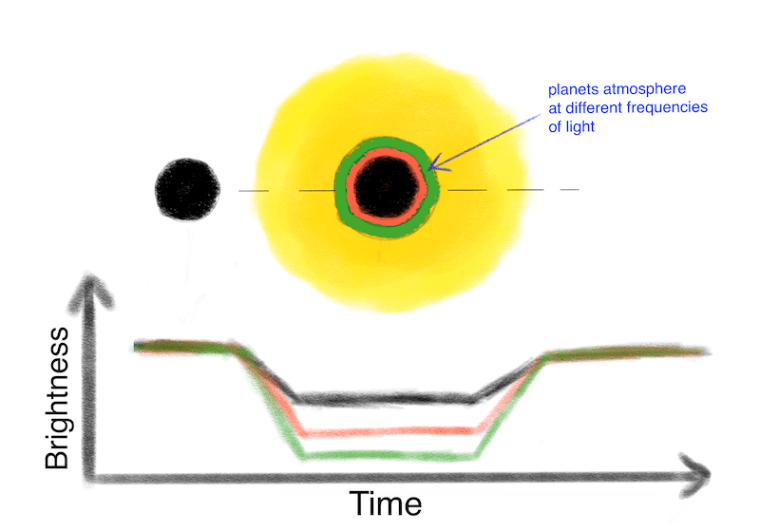
When a planet goes in front or transits its parent star, its main body blocks out some light of the star creating a dip in the light curve. But the atmosphere surrounding the planet around will also absorb some of this light depending on the gas molecules present in the atmosphere. This light is absorbed to different degrees at different wavelengths depending on the different gasses present in the atmosphere. ie the depth of the transit varies for different wavelengths.
Radius of transiting exoplanet is different when measured in different wavelengths. The light curve has the most dip (largest radii) for the wavelength that is absorbed by the planet’s atmosphere
The light will dip more for the wavelength which is absorbed by the planet’s atmosphere and therefore the radius of the planet will be bigger for that wavelength. Wavelengths that are not absorbed by the planet’s atmosphere will simply pass through and the radius of the exoplanet will be smaller in that wavelength.
Knowing what wavelengths are absorbed by different molecules, we can recreate the absorption spectrum and find out the atmospheric composition of the exoplanets.
Using Supervised Learning: Recurrent Neural Networks (RNN)
The data in the training set was already labeled. For each of the light curves, the ratio of the radius of the planet to the radius of the star was given. This meant I could use a supervised learning algorithm to make the predictions.
A supervised learning method is where the algorithm is taught what output results it should be getting for specific inputs. This is done by training the machine learning model on a labeled data set and then applying it to new unlabeled data. The machine learning model is then supposed to predict labels for this new data. In other words, the machine learning model creates a logic flow based on labeled data and uses this logic flow to predict output results for inputs it has not seen before.
For example, a machine learning model can be provided 5000 pictures labeled as cats and dogs. The model will then go through these pictures and learn what are the features of dogs and cats respectively. Now when new pictures are provided to the model, it will apply its learned behavior to identify them as cats and dogs.
In supervised machine learning, models are constructed based on labeled examples, that is, observations (e.g., images, photometric features) together with their outputs (also referred to as labels, e.g., the corresponding redshift or galaxy type). Most machine learning algorithms are built on the assumption that training and future test data follow the same distribution. This allows for generalization, enabling the model built from labeled examples in the training set to accurately predict target variables in an unlabeled test set.
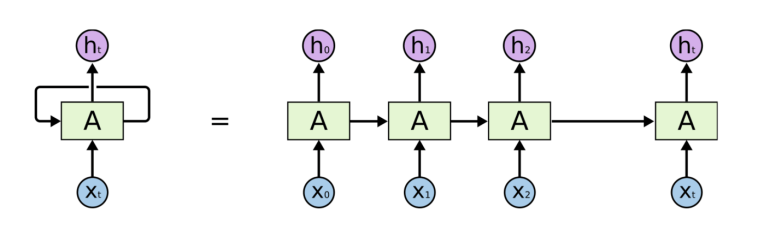
Recurrent Neural Network is useful where data is in sequential format and ordering matters such as in the case of the light curve generated during the time of transit of a planet over its parent star
There are many supervised learning algorithms, including Convolutional Neural Networks (CNN), Multi-Layered Perceptrons, Random Forests, and Recurrent Neural Networks (RNN).
Among those, I found the Recurrent Neural Networks (RNN) most suitable for this challenge. This is because RNNs work very well where the data is in sequential format and the order of numbers matter. When a planet is crossing a star, there is a dip in the light observed from the star. If we plot this change in star brightness on Y-axis and time on the X-axis, then a sequence representing a light curve will be observed. This sequential data can serve as an input to the neural network.
Setting up RNN to Predict the Radius of Exoplanets
An RNN has several parameters that need to be set before the training can begin.
The first stepis defining how many layers would the RNN have. More the layers, the more complex patterns it will be able to find and recreate. But there is a trade-off. Having too many layers will increase the training time and could overfit the neural network which is a frequent occurrence. Overfitting happens when a neural network makes accurate predictions on data it has already seen, but poorly when making predictions on new data. In my model, I decided to start with 3 layers.
The second step is to define how many neurons would be there in each layer. Again, too many neurons would overfit the RNN and reduce its accuracy on new data. For this challenge, I used 256 neurons for my training.
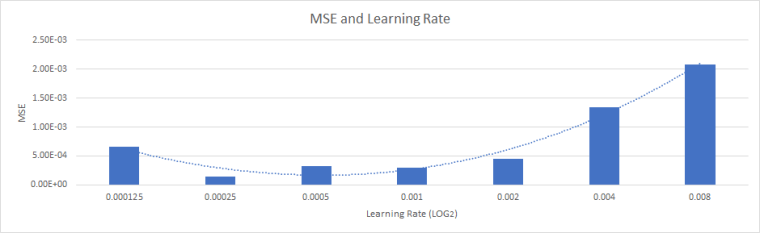
The third stepis setting the learning rate. The learning rate determines at what rate the Neural Network will learn and train itself. Very high learning may get the RNN to finish training faster but will make it unstable. As it goes through the training epochs, it will keep overwriting what it has learned before. It will not achieve high accuracy (or a low Mean Squared Error) no matter how long you train it. And a very low learning rate will not allow the neural network to fully learn the complexities and the accuracy rate will be lower. The most optimal learning rate can only be able to be found through trial and error.
To do this, I ran my RNN for 10 epochs with 7 different learning rates, starting from 0.008, and decreasing to 0.000125 with a log scale of 2. I plotted my results and found the best learning rate was 0.00025.
The RNN is now fully defined.
Determining an optimal training rate for my RNN using trial and error. The best learning rate for the given dataset was 0.00025.
The fourth and the final step before the training can begin is to specify the epochs the neural network would train for. One epoch means that the neural network has gone through the whole data set once to find patterns. Multiple epochs are required to train a neural network to its full potential. I trained the RNN to 2000 epochs, which took around 24 hours on my GPU-enabled computer.
Transforming Exoplanetary Data Into a 3D Array
I imported the entire dataset into Python and put it in an easily readable format. I then formatted the training data into a 3-dimensional array.
The first dimension was the planets for which the light curve was measured.
The second dimension was the 55 different wavelengths for which the light curve was generated.
The third dimension was the 300-time steps on which the light during the transit event was measured and led to the creation of the light curve.
The Performance of RNN
The inputs to my RNN were 55 sequences of light curves for every planet passing in front of its star, all taken in different wavelengths. This meant there would be 55 outputs, the predicted planet to star radius ratio for each wavelength.
At first, I thought it would be simpler to predict the radius ratio for each wavelength separately. But I realized that it would be more accurate to predict for all wavelengths in a light curve at the same time, as they are all related.
During its training, the RNN would go over the entire labeled dataset several hundred times. In each instance of the training, the RNN would go over a single data point consisting of one input and one output. It would then analyze the input and learn why a specific output is assigned to it. After enough training, it would be able to analyze new inputs it has not seen before and recommend an output based on that with reasonable accuracy.
I trained the RNN model 2000 times in my first attempt. To see how well my Neural Network could perform, I applied it to predict the relative radii of the planets in the test database. The results were then submitted to the Ariel ML Challenge website. It scored a 68% accuracy, which was not that bad for my very first attempt. Unfortunately, the competition closed before I could submit my subsequent attempts where I made substantial improvements in my algorithm and input data used for training it.
Future Plans
This challenge is not over for me. As I learn new things on machine learning and exoplanets I will keep improving my algorithm.
The orange line is the ground truth for relative radii. The blue line is the prediction of relative radii made by my improved algorithm.
To improve the accuracy of predictions, I have incorporated another part of the training dataset – the 6 stellar and planet parameters. This has pushed the predicted value of relative radii much closer to the ground truth.
2026 Third Place, Student Oral Competition, NASA Exploration Science Forum, USA. 2025 Third Grand Award, International Science and Engineering Fair, USA. NASA Group Achievement Award 2025 (DART mission team). 2024 Youth Can Innovate Award ($7,000) and Silver Medal, Canada-Wide Science Fair. Gloria Barron Prize for Young Heroes 2024. Eureka Changemakers Fellow 2025. 2023 Second Prize Winner – European Union Contest for Young Scientists (EUCYS). Best of the Fair Award, Gold Medal, Top of the Category, Youth Can Innovate, and Excellence in Astronomy Awards at Canada Wide Science Fair 2023 and 2022. RISE 100 Global Winner, Silver Medal, International Science and Engineering Fair 2022, Gold Medal, Canada Wide Science Fair 2021, NASA SpaceApps Global 2020, Gold Medalist – IRIC North American Science Fair 2020, BMT Global Home STEM Challenge 2020. Micro:bit Challenge North America Runners Up 2020. NASA SpaceApps Toronto 2019, 2018, 2017, 2014. Imagining the Skies Award 2019. Jesse Ketchum Astronomy Award 2018. Hon. Mention at 2019 NASA Planetary Defense Conference. Emerald Code Grand Prize 2018. Canadian Space Apps 2017.
Follow Us on Twitter
Do it Yourself Asteroid Astrometry using Python for Asteroid Apophis
The Masked Scales; 2020 NASA SpaceApps COVID-19 Challenge Global Winners!
Deep Space Musical: NASA SpaceApps 2018 Toronto Winner
LIGO Quadruple Pendulum: Swinging to Stability, Royal Astronomical Society of Canada 2019
TVO Kids (2018): TRAPPIST-1 Sound and Light Model
Lecture on TRAPPIST-1 at Carr Astronomical Observatory (CAO) Open House
Yes I Can / Oui Je Peux: NASA – Canadian SpaceApps Toronto 2017 Winner
Drop the Drought : NASA Space Apps Toronto 2017 Winner